 MetaTrader 5
 Experts
 Indicateurs
 Bibliothèque
 Utilitaires
 Widgets
 Règles
Regardez les tutoriels vidéo de Market sur YouTube
Comment acheter un robot de trading ou un indicateur
Exécutez votre EA sur
hébergement virtuel
hébergement virtuel
Test un indicateur/robot de trading avant d'acheter
Vous voulez gagner de l'argent sur Market ?
Comment présenter un produit pour qu'il se vende bien
Indicateurs techniques gratuits pour MetaTrader 5 - 32
 Les signaux provenant des indicateurs techniques jouent un rôle crucial dans l'ouverture et la clôture des transactions sur les marchés boursiers et les marchés forex. L'essence des indicateurs est une transformation mathématique du prix d'un symbole financier visant à prévoir les changements de prix futurs. Testez les indicateurs techniques pour mieux prédire le comportement du marché et en tirer profit.

MTF Trend Dashboard Pro for MT5 MTF Trend Dashboard Pro adalah indikator Multi Timeframe (MTF) profesional untuk MetaTrader 5 yang membantu trader mengetahui arah trend pada berbagai timeframe secara bersamaan dalam satu panel yang ringan, cepat, dan mudah dibaca. Indikator ini menampilkan status Bullish atau Bearish secara real-time mulai dari M1, M5, M15, M30, H1, H4, D1, W1 hingga MN , sehingga trader dapat dengan mudah melakukan analisis top-down sebelum mengambil keputusan entry. Fitur Utam
FREE
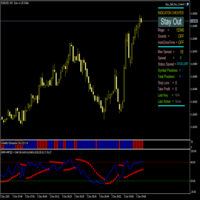
WPR+MFI Fusion avec Parabolic SAR Description :
L'indicateur combine deux oscillateurs (Williams Percent Range et Money Flow Index) avec l'indicateur de tendance Parabolic SAR dans une seule fenêtre. Les valeurs WPR et MFI sont moyennées, et le Parabolic SAR est construit sur la base de la ligne résultante. Principe de fonctionnement : Ligne Avg(WPR,MFI) - valeur moyenne entre le WPR (converti en plage 0-100) et le MFI Points Parabolic SAR - construits sur les valeurs de la ligne Avg(WPR,MF
FREE

The Kijun-sen , also known as the Base Line , is arguably the most critical component of the Ichimoku Kinko Hyo system. While many traders focus on the "Cloud," professional traders know that the Kijun-sen is the true heartbeat of market momentum and trend direction. This indicator calculates the midpoint of the highest high and the lowest low over the last 26 periods , providing a stable, medium-term view of the market’s equilibrium.
FREE

Introduction Poppsir is a trend-range indicator for metatrader 5 (for now), which distinguishes sideways phases from trend phases.
With this tool it is possible to design a trend following-, meanreversion-, as well as a breakout strategy.
This indicator does not repaint!
The signal of the Poppsir indicator is quite easy to determine. As soon as the RSI and Popsir change their respective color to gray, a breakout takes place or in other words, the sideways phase has ended.
Interpretation
FREE

L’indicateur Break Tracer est un système de tendance sans repaint pour MetaTrader 5. Il combine trois outils de tendance indépendants en un seul indicateur visuel : une paire d’EMAs rapides (par défaut 26 / 50), une moyenne mobile de tendance à 200 périodes (EMA ou SMA, avec ancrage optionnel sur une unité de temps supérieure) et un canal basé sur l’ATR qui filtre les phases de range. Un signal directionnel n’est déclenché que lorsque les trois composants sont alignés : la bougie doit clôturer e
FREE
Indicateur Average True Range (ATR) avec support multi-unités de temps, signaux visuels personnalisables et système d'alertes configurable.
Services de programmation freelance, mises à jour et autres produits TrueTL disponibles sur mon profil MQL5 .
Les retours et avis sont très appréciés !
Qu'est-ce que l'ATR ? L'Average True Range (ATR), développé par J. Welles Wilder, est un indicateur technique qui mesure la volatilité du marché. Il calcule la moyenne de la True Range sur une période donn
FREE

The Simple Background MT5 indicator was created to provide traders with the ease of customizing their MetaTrader interface with a preferred background/wallpaper image. It's very straightforward.
Let's get straight to the point:
1. Install the indicator;
2. Choose your preferred image in formats such as jpg, png, etc. Open the image in Paint and save it as a .bmp file;
3. After saving the image as a .bmp file, place it in the images folder (following this path in the MQL5 terminal: \Images);
FREE
The WaveTrend Oscillator indicator is an enhanced version of the classic WaveTrend Oscillator, a momentum indicator. It is designed to identify overbought/oversold conditions and provide potential trend reversal signals. The core difference in this version is the application of a data "normalization" algorithm. This ensures the indicator's oscillation lines remain balanced around the zero line, causing the indicator window to always stay naturally centered. This is especially useful when trading
FREE

The MT5 K-Line Countdown Indicator is a professional and lightweight utility for MetaTrader 5. It displays the remaining time before the current candlestick closes, helping traders accurately manage entries, exits, and price action strategies. There are even better indicators—get them here. https://www.mql5.com/en/users/aa996a/seller Features: Accurate Real-Time Countdown
Powered by both OnCalculate() and 1-second OnTimer() technology, the countdown continues smoothly even during low-volatility
FREE
L'indicateur Flower est un outil d'analyse technique principalement utilisé pour identifier les tendances et faciliter les stratégies de scalping ou de trading intraday.
L'indicateur Flower est un indicateur de tendance basé sur l'analyse technique et la dynamique des prix. Il signale visuellement les tendances grâce à des fleurs colorées : les bleues indiquent une tendance haussière, les rouges une tendance baissière.
Chaque niveau peut agir comme support et résistance (attention aux niveaux
FREE

This MQL5 indicator draws four Exponential Moving Averages (EMAs) — 21, 50, 100, and 200 — directly on the chart window.
The EMA 21 is displayed as a color-changing line , while EMA 50, 100, and 200 are standard single-color lines.
The color of EMA 21 changes dynamically based on price position.
When the closing price is above EMA 21 , the line turns blue , indicating bullish pressure.
When the closing price is below EMA 21 , the line turns yellow , indicating bearish pressure.
If the price equa
FREE

This is our version of the Bull Market Support Band indicator.
This indicator contains two moving averages: one simple and one exponential. Together, they represent a support band that can be used in both bull and bear markets.
Although originally designed for the weekly chart, it can be used on any timeframe.
Our version adds a candle coloring rule: green for closes above the band and red for closes below.
The default value is 20 for the Simple Moving Average (SMA) and 21 for the Exponentia
FREE
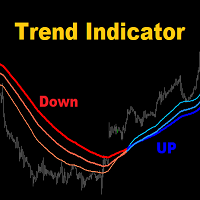
MA3 Trend MT5 - is the good trend indicator on three MAs . Benefits of the indicator: The indicator produces signals with high accuracy.
The confirmed signal of the indicator does not disappear and is not redrawn.
You can trade on the MetaTrader 5 trading platform of any broker.
You can trade any assets (currencies, metals, cryptocurrencies, stocks, indices etc.).
You can trade on any timeframes (M5-M15 scalping and day trading / M30-H1 medium-term trading / H4-D1 long-term trading). Indi
FREE
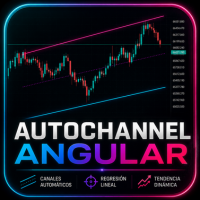
AutoChannel Angular Dibuje automáticamente canales de tendencia dinámicos utilizando regresión lineal AutoChannel Angular es un indicador para MetaTrader 5 que genera automáticamente canales de tendencia mediante un algoritmo basado en regresión lineal . Analiza el comportamiento del precio dentro de un período configurable y proyecta un canal compuesto por una línea superior, una línea media y una línea inferior, proporcionando una referencia objetiva sobre la dirección predominante del mercado
FREE

Instructions for the Dynamic_DOM_Labels indicator Dynamic_DOM_Labels is a professional analytical tool for the MetaTrader 5 terminal, designed to analyze the Order Flow in real time. The indicator connects directly to the broker's Depth of Market /DOM, finds large limit orders from buyers (Buy Limit) and sellers (Sell Limit) and projects them onto the work schedule. The tool is designed specifically for liquid markets such as Gold (XAUUSD) and major currency pairs (for example, GBPUSD), where la
FREE

HTF Open Markers + ICT Silver Bullet Zones — Usage & Strategy Guide What it draws Session 1 / Session 2 lines : vertical lines at the open of every bar on two independently configurable higher timeframes (defaults: H4 and D1), including a projected line for the rest of today's not-yet-opened bars on sub-daily timeframes, so you can see where the next candle will open before it happens. ICT Silver Bullet zones : shaded rectangles over the three classic ICT kill-zone windows, converted from New Yo
FREE

Master Waves pour MetaTrader 5 Description Master Waves est un indicateur technique développé pour MetaTrader 5 qui organise le volume en vagues de mouvement du prix. L'indicateur analyse la direction de chaque bougie et accumule le volume tant que le mouvement reste dans la même direction. Lorsqu'un changement de direction se produit, une nouvelle vague commence. Les vagues sont affichées sous forme d'histogramme dans une fenêtre séparée. Les vagues associées aux mouvements haussiers et baissie
FREE

Opening Range Indicator
Idea Toby Crabel introduced this way of trading in the ealy ninties in his book "Day Trading with Short Term Price Patterns and Opening Range Breakout". In simple terms this means to trade the brekouts from the limits of the first trading hour with the stop loss at the opposite side. I.e. if the first hourly candle meausres 40 points (Crabel calls this the "stretch") you set the stop loss at breakout level minus 40 points and the take profit at the breakout level plus 4
FREE
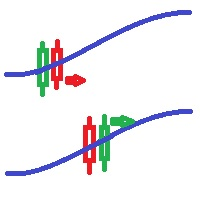
Bollinger bands out/in strategy A strategy created by Joe Ross, and very useful for finding trades when the market is overloaded. Indicator You don't need to find where there are entries on the chart, this indicator shows them for you. The entrance The trade is confirmed when the price closes outside the bollinger bands on a candle and the candle after the price closes inside the bands. comment I want to improve this indicator, so you can help me sending me your reviews and comments, thanks :).
FREE

MACD Advanced with Colored is an enhanced MACD indicator for MetaTrader 5 with a four-color system that makes trend and momentum easy to read at a glance. Features Four-color histogram: strong bullish, weak bullish, weak bearish and strong bearish, so momentum and its trend are clear instantly. Standard MACD engine: keeps the familiar MACD/Signal calculation, just clearer to read. Quick momentum context: the color distinguishes accelerating from fading moves, which a plain MACD does not. Works o
FREE

ATR_Dashboard indicator: description and principle of operation ATR_Dashboard is an auxiliary tool for MetaTrader 5 that visualizes the current state of volatility for a trading instrument based on the Average True Range (ATR) indicator. It does not generate direct signals to enter a position, but helps the trader assess how much the price has already gone over the current day relative to the average move (ATR), and see benchmarks where this average move may end. How the indicator works: step-b
FREE

Pattern Scanner & Candle Timer pour MT5
Pattern Scanner & Candle Timer est un indicateur visuel tout-en-un conçu pour aider les traders à identifier rapidement les figures en chandeliers clés en temps réel, tout en suivant le compte à rebours avant la clôture de la bougie et les mouvements de pips en direct directement sur le graphique.
Au lieu de passer du temps à analyser manuellement les graphiques, cet outil met automatiquement en évidence les figures composées d'une, deux ou trois bougies
FREE

Original supertrend indicator in Tradingview platform. Indicator type: Price Action indicator Introduction: The Supertrend Indicator - Enhancing Your Trend Analysis. If you haven't yet found a Supertrend indicator with good graphics on the MQL5 platform, this is the indicator for you. Overview: The Supertrend Indicator is a powerful tool designed to provide traders with valuable insights into the current and historical trends of financial markets. It serves as a valuable addition to any t
FREE
I'm sure after a lot of research on the internet, you haven't found any indicator that can help you with forex or binary trading in the latest probability strategy created by famous trader Ronald Cutrim. The strategy is based on a simple count of green and red candles, checking for a numerical imbalance between them over a certain period of time on an investment market chart. If this imbalance is confirmed and is equal to or greater than 16%, according to trader Ronald Cutrim, creator of the pro
FREE

The Multi-Timeframe VWAP is a high-precision tool designed to reveal institutional "fair value" across multiple horizons simultaneously. Unlike standard indicators, it integrates volume and price data from Daily, Weekly, and Monthly periods onto a single chart. This allows traders to identify high-confluence zones where major market players are positioned. By visualizing where macro trends intersect with intraday action, it eliminates guesswork, highlighting professional support and resistance l
FREE

Enjoy the Free Candle Color indicator.
Kijun Sen is an element of Ichimoku Kinko Hyo Indicator, it's far too complicated for many traders hence they tend to be confused. We have simplified it so the Kijun Sen will change colors as it activates without the Tenkan Sen, Senkou Span, Up Kumo and Down Kumo. Customize to your period parameter and colors of your choice. Great for beginners and seasoned traders. Set your period and enjoy
GOOD LUCK and ALL THE BEST IN YOUR TRADING JOURNEY !!!!!
FREE

Risk Reward Ratio Calculator - a free tool that tells you instantly whether a trade is worth taking. Enter your entry, stop-loss and take-profit prices and see the risk/reward ratio, potential loss and potential profit before you open the position. Successful traders only take trades with a favourable reward compared to risk. This calculator draws your entry, stop and target directly on the chart and shows the exact R:R multiple, so you can reject bad setups and size good ones correctly. Feature
FREE

Smart Structure Zones ICT Smart Structure Zones ICT is a MetaTrader 5 chart indicator for structure-based price analysis. It displays market structure, BOS, CHoCH, order block zones, fair value gaps, equal highs and lows, premium/discount areas, and higher-timeframe highs and lows directly on the chart. The indicator is made for traders who use price action, structure analysis, liquidity zones, order blocks, fair value gaps, and multi-timeframe levels as part of their chart study. Main Features
FREE

DiNapoli DMAs (Moyennes Mobiles Déplacées) L'indicateur DiNapoli DMAs apporte sur MetaTrader 5 les célèbres moyennes mobiles déplacées, popularisées par le légendaire trader Joe DiNapoli. Contrairement aux moyennes mobiles classiques, le décalage vers le futur (shift) aide à filtrer le bruit du marché et à réduire les faux signaux, permettant au trader d'identifier les tendances et les niveaux de support/résistance avec une clarté bien supérieure. Cet indicateur trace les trois combinaisons clas
FREE

this free candle stick timer works on all symbol and all timeframe, in dicator help you to see remain time in hours, minutes, seonds until it close, it is simple and easy to use and very light, it doesn't not consume much RAM, CPU. you can change font size and can change color of the indicator and what time frame you want it to work on, you also can choose to disable it on specifix time frame.
FREE
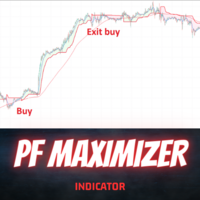
Introduction
The PF Maximizer is a game-changing non-repainting technical tool engineered to help traders distinguish genuine trend signals from erratic market fluctuations. By employing sophisticated algorithms and cutting-edge data analysis, this indicator efficiently filters out unwanted noise, empowering traders to identify the precise starting and ending points of substantial market moves.
Signal
Potential buy signal is generated when moving average is going up and the blue line cross a
FREE

Prime Power est un outil d'analyse professionnel pour MetaTrader 4 conçu pour identifier en temps réel la force et la faiblesse de 8 devises majeures. Contrairement aux indicateurs traditionnels qui analysent une seule paire, ce système surveille l'ensemble du marché Forex simultanément, révélant des tendances puissantes et des points de retournement à haute probabilité grâce à la comparaison mathématique des flux de capitaux relatifs. Fonctionnalités Principales & Instructions Utilisateur 1. Ta
FREE

Aperçu
Heiken Ashi Smoothwave transforme votre graphique en bougies Heiken Ashi lissées directement dans la fenêtre principale du graphique, remplaçant les bougies standard pour une vue de tendance plus claire. Pas de fenêtre séparée, pas d'encombrement. Fonctionnement Calcule les valeurs OHLC Heiken Ashi à partir des données de prix réelles sur chaque bougie. Trace des bougies Heiken Ashi colorées directement sur le graphique principal. Masque automatiquement les bougies natives du graphique,
FREE

The trend can change while your attention is focused elsewhere. And sometimes, by the time you notice that the market has changed direction, the move is already several candles ahead. Cartwright TrendTrace Classic makes the current direction and confirmed trend changes easy to recognize — clearly, visually and without filling your chart with unnecessary tools. The indicator transforms a standard moving average into a simple directional guide. The line turns blue when it is rising and red when it
FREE
Si tu trades sur les marchés financiers, tu sais sûrement à quel point le spread est important – cette différence entre le prix d'achat (ask) et de vente (bid) peut sérieusement affecter ton profit. Spread Size est un indicateur simple mais très utile qui affiche le spread actuel directement sur le graphique. Plus besoin de surveiller constamment les données manuellement – tout est juste sous tes yeux ! À quoi ça sert ?
Le spread n'est pas qu'un chiffre. C'est ton argent réel. Un spread bas
FREE
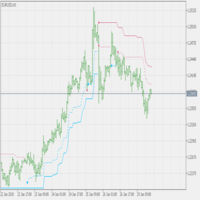
Developed by Charles Le Beau and featured in Alexander Elder's books, the Chandelier Exit sets a trailing stop-loss based on the Average True Range (ATR). The indicator is designed to keep traders in a trend and prevent an early exit as long as the trend extends. Typically, the Chandelier Exit will be above prices during a downtrend and below prices during an uptrend.
Calculation
The original Chandelier Exit formula consists of three parts: a period high or period low, the Average True Rang
FREE

QuantumAlgo Basic Indicator — Indicateur Multi-Fonction pour MetaTrader 5 QuantumAlgo Basic Indicator est un indicateur multi-usage professionnel pour MetaTrader 5. Transforme votre terminal en station d'information avec données de marché en temps réel et niveaux institutionnels clés. Pourquoi choisir QuantumAlgo Basic Indicator UI professionnelle propre — design Glassmorphism Données de marché en temps réel Timing de volatilité Niveaux institutionnels journaliers (PDH, PDL, Pivot, Open) Session
FREE
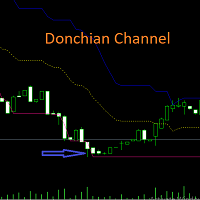
Harness the Power of Donchian Channels for Trend Trading
The Donchian Channel Indicator may your key to precision trading. With Donchian channels, you'll gain insights into market volatility, breakouts, and overbought/oversold conditions. This winning strategy is named after its developer, Richard Donchian.
How Does the Donchian Strategy Work? The upper band represents the previous period's highest high; The lower band represents the previous period's lowest Low; The centre band reflects
FREE

Infinity Predictor MA
Infinity Predictor MA is a next‑generation forecasting indicator that transforms the traditional Moving Average into a powerful predictive tool. Unlike standard MAs that only smooth past data, this indicator projects the moving average line up to 40 bars into the future, giving traders a unique perspective on potential market direction.
The engine behind Infinity Predictor MA combines multiple advanced regression models to capture both smooth trends and sudden market shi
FREE

MA HTF PO3 Fib Timer V1.20 helps traders keep higher-timeframe structure visible directly on the current chart without switching between timeframes. This indicator combines higher-timeframe candle visualization, moving averages, live timing, and key price references in one clean workspace for faster chart reading and better execution focus. Main features: - Higher-timeframe candle overlay on the active chart - Up to 3 moving averages - Candle countdown timer - Live HTF high and low levels - Hist
FREE

### Coral Trend Indicator v1.0
The Coral Trend Indicator is a faithful port of LazyBear's TradingView script (10,900+ favorites) to MetaTrader 4 and MetaTrader 5. It applies Tim Tillson's T3 Moving Average algorithm (1998) as a color-coded trend filter on the price chart.
#### How it works
The indicator passes the price through six cascaded Exponential Moving Averages, then combines stages 3 through 6 using binomial polynomial coefficients derived from the Constant D parameter. This pro
FREE
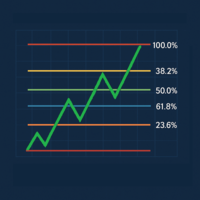
L'indicateur Last Candle Fibonacci permet de visualiser facilement les niveaux de Fibonacci de la bougie précédente. Adaptable à toutes les unités de temps, il fonctionne sur les principales paires de devises et aide les traders à identifier plus clairement les zones de retournement. Conçu pour s'intégrer parfaitement au graphique, il met en évidence les niveaux clés confirmant les replis, les points d'entrée potentiels et les objectifs. Léger, stable et pratique, c'est un outil idéal pour une a
FREE

QM FlowVision X1 Visual Multi-Factor Trading Indicator with Historical Probability, Market Flow, Momentum, Divergence and Multi-Timeframe Context QM FlowVision X1 is a visual decision-support indicator for MetaTrader 5 designed to transform multiple market conditions into a simple and readable trading state. Instead of displaying isolated oscillators without interpretation, FlowVision combines momentum, money flow, RSI, Stochastic RSI, divergence and higher-timeframe context into a unified 0–100
FREE

PivotScannerPro — Multi-Symbol Multi-Timeframe Pivot & EMA Scanner PivotScannerPro is a free, all-in-one dashboard that scans multiple symbols across multiple timeframes at once — so you can spot trade opportunities without opening dozens of charts. Built by the community, for the community. WHAT IT DOES The scanner shows a clean dashboard with every symbol on the left and your chosen timeframes (M15 / H1 / H4 / D1) across the top. Each cell tells you three things at a glance: SIGNAL — a fresh B
FREE
Like most things that work in trading, it's really simple. However, it's one of the most powerful tools I have that makes entries of many systems much more precise.
In its essence, it measures the recent volatility against the medium-term average. How does it work? Markets tend to be prone to strong trending movements when relative volatility is low and tend to be mean-reverting when relative volatility is high.
It can be used with both mean-reversion systems (like the Golden Pickaxe) and mo
FREE

Little useful tool - you manually select range on chart by dragging vertical blue lines and indicator shows support and resistance zones for this range and extends them outside of selected range.
Useful for:
* Range trading
* Range breakout
* Range breakout & retest
* Good entry during pullback in trend phase when previous high is retested
* Good for scalping on short timeframes
* Good for trades on longer timeframes around selected important zones like daily high or low
FREE
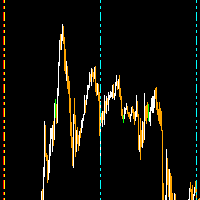
The daily custom period seperator indicator allows you to draw period seperators for your lower time frame charts H1 and below. The period seperator gives you options to set different colors for: Weekend - saturday/sunday Monday and Friday Midweek - Tuesday to Thursday.
By default the indicator plots the period seperator line at 00:00 hours for the last 10 days.
Use Cases: The indicator can be used as a colourful alternative period seperator to the default MT5 period seperator. For those tha
FREE

Nova Auto Pitchfork Premium Give market structure a clearer framework. Price often moves through rising or falling channels, but choosing meaningful anchors manually can be inconsistent. Nova Auto Pitchfork Premium identifies confirmed swing points and constructs a pitchfork that helps you evaluate trend direction, channel boundaries, and price reactions. Its value is a repeatable structural map: a way to judge where price sits within the selected channel and recognise when it rejects or moves b
FREE
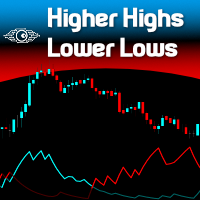
"Spotting emerging trends, defining correction periods, and anticipating reversals can benefit your trading in many ways..." So be it: Higher Highs & Lower Lows indicator. This is an indicator created by Vitali Apirine and presented to the public through the article "Time To Buy. Time to Sell - It's a Stochastic, Higher Highs & Lower Lows" in the Stocks & Commodities magazine . This is a Momentum indicator that helps determine the direction of a trend. Higher Highs and Lower Lows are two indicat
FREE
VR Ticks est un indicateur spécial pour les stratégies basées sur le scalping. Grâce à cet indicateur, le trader peut voir le graphique des ticks directement sur le graphique principal de l'instrument financier. Un graphique à ticks vous permet d'entrer une position sur le marché ou de clôturer une position sur le marché aussi précisément que possible. VR Ticks trace les données des tiques sous la forme de lignes qui changent de couleur en fonction de la direction - cela vous permet de compren
FREE

Rojeryo PA Suite is a multi-tool price action indicator for MetaTrader 5.
The indicator is designed for traders who use price action, market structure, liquidity zones and SMT-style comparison analysis. It draws important chart areas directly on the price chart and helps the user monitor structure breaks, imbalance areas, possible reaction zones and ATR-based distance values.
The indicator does not open trades, does not close trades and does not manage positions. It is a visual analysis tool
FREE

Indicateur Composite Index avec support multi-timeframe, signaux visuels personnalisables et système d'alertes configurable.
Services de programmation freelance, mises à jour et autres produits TrueTL sont disponibles sur mon profil MQL5 .
Les retours et avis sont très appréciés !
Qu'est-ce que le Composite Index ? Le Composite Index a été développé par Constance Brown comme outil pour surmonter les défaillances de swing du RSI sur les marchés en tendance. Il combine le momentum du RSI (la di
FREE

Inverse Probability Distribution — Pivot Density and K-Means Clustering Indicator Platform: MetaTrader 5 Overview This indicator is a technical analysis visualization tool for MetaTrader 5. It identifies confirmed pivot highs and lows on historical bars, groups pivot prices with K-Means clustering, and draws an inverse distribution profile on the right side of the chart. The profile shows the density of historical pivot prices at different price levels. The indicator does not generate trading s
FREE

PropFirm Risk Guard est un utilitaire professionnel conçu pour assister les traders dans le calcul précis de la taille de leurs positions. Dans l'environnement des Prop Firms, le respect strict des règles de gestion des risques est critique. Cet outil automatise le processus mathématique, aidant les traders à maintenir des paramètres de risque cohérents grâce à une interface visuelle intuitive . Fonctionnalités Clés NOUVEAU : Stop Loss Visuel Interactif : Plus besoin de calculer les point
FREE

Correlation Matrix Pro - Analyse Multi-Devises Comprenez les relations entre les paires de devises en temps réel ! Un puissant outil d'analyse qui vous aide à visualiser les relations statistiques entre jusqu'à 6 paires de devises simultanément. Parfait pour la gestion de portefeuille, la diversification des risques et les stratégies de couverture. FONCTIONNALITÉS PRINCIPALES - Corrélation de Pearson en temps réel avec rendements logarithmiques - Surveillance de jusqu'à 6 paires de devises simu
FREE

Avez-vous déjà pensé à avoir un scanner qui analyse toutes les stratégies et montre les points d'achat et de vente sur tous les délais de cet actif, le tout en même temps ? C'est exactement ce que fait ce scanner. Il a été conçu pour afficher les signaux d'achat et de vente que vous avez créés dans le Rule Plotter : créateur de stratégies sans programmation et les exécuter dans ce scanner sur différents actifs et délais. La stratégie par défaut du Rule Plotter se compose uniquement des bougies h
FREE

Huit moyennes mobiles sur un seul graphique, une flèche BUY ou SELL à chaque croisement des deux que vous choisissez, et un panneau de contrôle qui modifie tout cela sans ouvrir la fenêtre des paramètres. La plupart des outils de moyennes mobiles vous donnent deux lignes et une règle figée. Celui-ci vous donne huit lignes, vous laisse choisir lesquelles génèrent le signal, et vous permet de changer d'avis depuis le graphique — période, méthode, couleur, épaisseur, type de trait, forme de flèche,
FREE

Please feel free to join this Telegram group where users can share their strategies and settings that work for them using this indicator --> t.me/MTFMACS
ALSO AVAILABLE ON TRADINGVIEW The MTFMACS family is now available on TradingView for users who prefer charting on that platform. Contact me via the Telegram group for direct access. ABOUT THIS FREE VERSION
Th
FREE

Know exactly when the market is active. Session Map displays the major Forex trading sessions directly on your chart and in a live panel.
WHAT IT SHOWS ON THE CHART: - Colored background boxes for each session: Tokyo (blue), London (green), New York (orange) - London and New York overlap highlighted in yellow — the most volatile period of the day - Draws the last 3 days automatically so you can compare session behavior
WHAT THE PANEL SHOWS: - Live server time clock updated every second - Stat
FREE

Индикатор для синхронизации и позиционировании графиков на одном и более терминалах одновременно. Выполняет ряд часто необходимых при анализе графиков функций: 1. Синхронизация графиков локально - в пределах одного терминала при прокрутке, изменении масштаба, переключении периодов графиков, все графики делают это одновременно. 2. Синхронизация графиков глобально - тоже самое, но на двух и более терминалах, как МТ5, так и МТ4. 3. Позиционирование графика на заданном месте при переключении периодо
FREE
Linear Regression Channel – Indicator The Linear Regression Channel is a custom MT5 indicator that plots a regression line through price over a specified number of bars, with dynamic support and resistance boundaries. Central Line (BlueViolet):
Represents the linear regression line (best-fit line) based on the selected price type (Close or High/Low). Upper Line ( Li me):
Represents the regression-based resistance level, adjusted dynamically according to the highest deviation from the regressi
FREE

This is the Stargogs Volatility Arrow V1 Yeahhh!!! This Arrow is based on trend, support and demand and based on EMA's. You can change the parameters or settings like you want to. Message Me for the System which works best with this Indicator for free (include: Template, and other indicators). This indicator works with all Currency Pairs, All Volatility indices, All Indices, Boom & Crash Indices, Gold and NASDAQ. Works on All Timeframes Add the following to your chart with Stargogs Volatility A
FREE
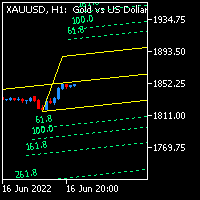
Andrew Pitch fork is one of the most interesting string trend & Channel & Fibo technical analysis , it's like ALL in ONE tool would be very enough for you.
Using 2 Andrew pitch Forks with 2 different time frames on same chart is really very hard working and might be impossible , but with this indicator is possible now , moreover , using this method as Candle Volume based analysis give strong trust for your trade.
I assume if you are having 1 daily pith fork lets say with 22 Candle value , and
FREE
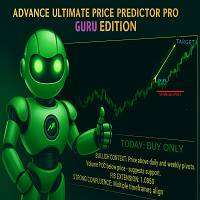
THE ADVANCE PRICE PREDICTOR - GURU EDITION Tired of Guesswork?
Meet the AI-Powered "Almighty Predictor" – Pinpoints High-Probability Targets Before the Move, With Surgical Precision
Stop chasing pips. Start attracting them. Our proprietary algorithm fuses Multi-Timeframe Analysis + Smart Money Concepts + Real-Time Confluence Scoring to give you a clear, calculated edge on every trade.
Are You Constantly Wondering…
"Is this the top, or will it keep going?"
"Where should I real
FREE

# ApexForge KTimer
### Compte à rebours des bougies MT5, compte à rebours de fermeture du marché, gestion des jours fériés et des fermetures anticipées, panneau de minuterie déplaçable
ApexForge KTimer est un outil d'affichage du temps et de l'état du marché conçu pour MetaTrader 5.
KTimer affiche le temps restant avant la clôture de la bougie actuelle et fournit également un compte à rebours jusqu'à la fermeture de la session de marché, des informations sur l'état du marché ainsi que la gest
FREE

L'indicateur qui affiche l'heure actuelle sur les principaux marchés du monde. Il affiche également la session en cours. Très facile à utiliser. Il n'occupe pas beaucoup d'espace sur un graphique. Il peut être utilisé avec des Expert Advisors et d'autres panneaux, tels que VirtualTradePad . La version de style classique. Chers amis et utilisateurs de nos EA, veuillez ajouter vos notes dans la section Avis. Toutes les mises à jour de notre logiciel forex sont gratuites ! Ceci est un u
FREE
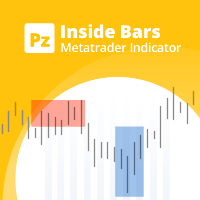
Enhance your price action strategy: inside bar breakouts at your fingertips
This indicator detects inside bars of several ranges, making it very easy for price action traders to spot and act on inside bar breakouts. [ Installation Guide | Update Guide | Troubleshooting | FAQ | All Products ] Easy to use and understand Customizable color selections The indicator implements visual/mail/push/sound alerts The indicator does not repaint or backpaint An inside bar is a bar or series of bars which is/
FREE

Tradez-vous la tendance ou juste le bruit ? La plupart des indicateurs sont trop lents ou ne génèrent que de faux signaux en marché latéral. NeuroTrend Cloud résout exactement ce problème. Qu'est-ce que NeuroTrend Cloud ?
Un indicateur de tendance intelligent qui réunit deux mondes : La Ligne Médiane (KAMA) : Mesure l'efficacité avec laquelle le prix évolue. En forte tendance elle devient rapide, dans le bruit elle devient lente.
Le Nuage (ATR) : Mesure la volatilité. Quand la volatilité est él
FREE
TrendBite v1.5 - Indicateur professionnel de suivi des tendances Développeur : 8aLt4 Version : 1.5 Plateforme : MetaTrader 5
Aperçu TrendBite v1.5 est un indicateur d'analyse technique avancé conçu pour détecter les changements de tendance sur le marché et fournir aux investisseurs des signaux d'achat et de vente clairs. Basé sur l'algorithme des bandes de Bollinger, cet outil détecte avec précision les changements de tendance et est idéal pour les traders débutants comme pour les traders exp
FREE

Multi-Timeframe High Low Marker - Key Level Projection Utility
Multi-Timeframe High Low Marker is an essential utility indicator for MetaTrader 5 that automatically identifies and projects the historical high and low levels of previous Daily, Weekly, and Monthly candles onto your current chart.
In financial markets, historical highs and lows represent key structural points where institutional orders, retail breakout triggers, and liquidity pools cluster. This indicator acts as an automated s
FREE
MetaTrader Market - les robots de trading et les indicateurs techniques pour les traders sont disponibles directement dans votre terminal de trading.
Le système de paiement MQL5.community est disponible pour tous les utilisateurs enregistrés du site MQL5.com pour les transactions sur les Services MetaTrader. Vous pouvez déposer et retirer de l'argent en utilisant WebMoney, PayPal ou une carte bancaire.

Vous manquez des opportunités de trading :
- Applications de trading gratuites
- Plus de 8 000 signaux à copier
- Actualités économiques pour explorer les marchés financiers
Inscription
Se connecter
Vous acceptez la politique du site Web et les conditions d'utilisation
Si vous n'avez pas de compte, veuillez vous inscrire