Multiple Timeframe Filtered MA Crossover Signals

What makes this indicator different?

Most moving average crossover indicators on the market do one thing: they watch two moving averages cross and they fire an arrow the moment the cross happens. Every cross. Every time. Whether the market is ranging, whether the higher timeframe agrees, whether momentum supports the move, whether the price is at a logical entry point — none of that matters to them. You get arrows. Lots of arrows. Most of them useless...

This indicator was built on a different premise — that a crossover is only as valuable as the context that confirms it.

Instead of two moving averages, you can stack more than ten moving averages on a single timeframe and require all of them to be in a specific order before a This filter is one of the greatest strength of this indicator signal is considered valid. Instead of ignoring the higher timeframe, you can filter every signal through an MA trend check on any timeframe. Instead of ignoring momentum, you can require RSI and MACD to agree. Instead of ignoring where price actually is, you can require the signal to happen at a Fibonacci retracement level inside the previous higher-timeframe candle.

Combine as many or as few of these layers as your strategy demands. The result is not a flood of arrows and alerts — it is a small, deliberate set of signals that survived every filter you chose to enable.

A note on the clean chart

After you apply the indicator and finish configuring it, you will notice something: no moving averages appear on the chart. This is intentional.

The indicator draws only signal arrows — and only when you have enabled them. The moving averages that drive the logic stay hidden. The intention is to give you a chart that stays genuinely clean, so you can practise other forms of analysis on the same chart without noise competing for your attention: drawing trendlines, marking order blocks, applying other indicators, or reading price action directly.

On TradingView, hiding an indicator temporarily is trivial — you click the eye icon and it disappears until you want it back. On MetaTrader 5, that option does not exist. If you want to hide an indicator, you have to remove it from the chart and re-apply it later, which means going back and forth every time. Rather than force that workflow on you, the indicator simply never draws the MAs in the first place.

If you do want to see the moving averages on the chart, you can add them manually — one by one — using the same periods you configured in the indicator's inputs. Once you have them arranged the way you like, save the chart as a template. Next time, loading that template restores all of them in a single click. This gives you the best of both worlds: a visual reference of the MA stack when you want it, and a clean chart when you don't, without ever having to touch the indicator itself.

Seeing the MAs on the chart also lets you visually verify that the indicator is firing correctly — you can watch the exact cross of your chosen pair happen, and confirm the arrow alerts and arrows appears where you expect it to.

How the indicator works, section by section

1. Alert Configuration

Decide how a signal reaches you. Each option is independent.

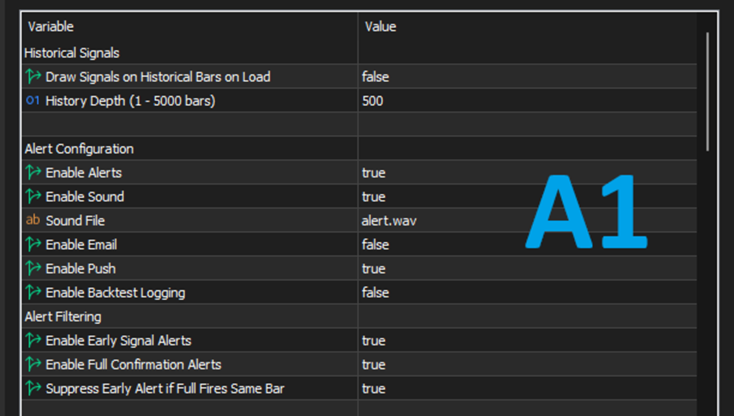
  • Enable Alerts — pop-up alert window.

  • Enable Sound — plays your chosen .wav file.

  • Enable Email — sends to your terminal-configured email.

  • Enable Push — sends to your MetaTrader mobile app.

  • Enable Backtest Logging — writes diagnostic values to the Experts log for tuning.

2. Alert Filtering

  • Enable Early Signal Alerts — receive Early signal alerts.

  • Enable Full Signal Alerts — receive Full signal alerts.

  • Suppress Early Alert if Full Fires Same Bar — when Early and Full fire on the same bar for the same direction, only the Full alert is sent, avoiding a duplicate notification.

3. Arrow Appearance

  • Draw Arrows — No Arrows (alerts only, cleanest chart), Early + Full Signals, or Full Signals Only.

  • Arrow Size — 1 to 5.

  • Arrow Distance from Candle — pixel offset for the arrows.

Image A1—Screenshot showing the indicator's arrow input section on the indicator's menu.

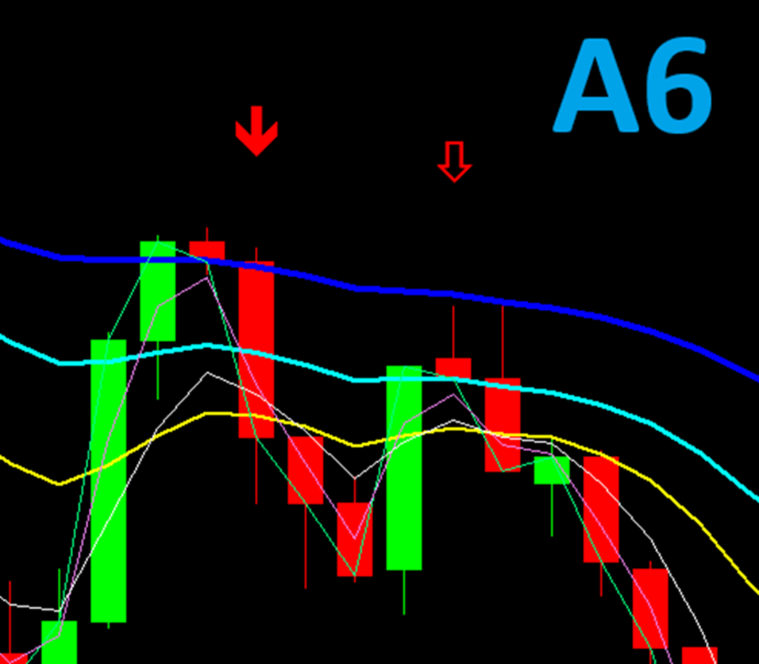
Image A6—Screenshot showing the indicator's arrow appearance, with the hollow arrows representing the early signals and the full body colored arrows representing full signals.

4. Signal Filter

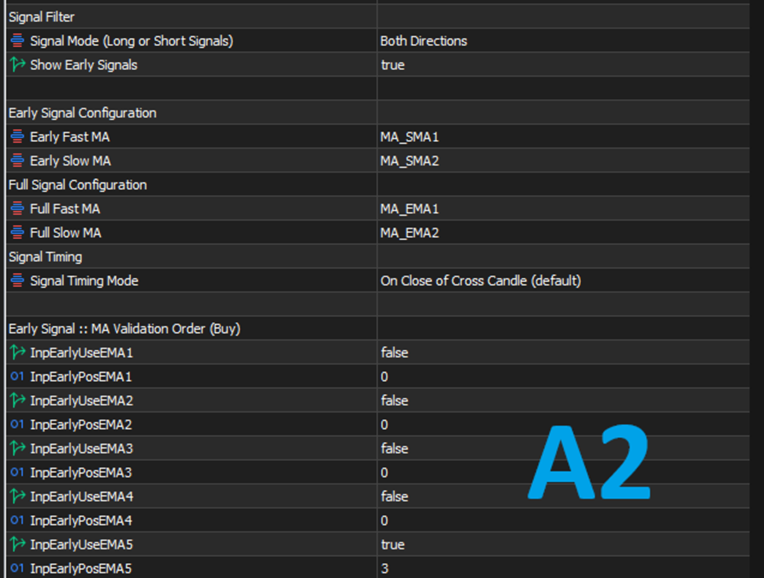
  • Signal Mode — Long Only, Short Only, or Both Directions.

  • Show Early Signals — master switch for the Early subsystem.

5. Early Signal Configuration

The Early signal is designed to detect the crossover earlier in its development — before the full validation stack lines up — giving you a heads-up that a Full signal may be forming.

  • Early Fast MA — the fast moving average for the Early cross.

  • Early Slow MA — the slow moving average for the Early cross.

Both are chosen from a large library that includes Exponential, Weighted, and Simple moving averages at every common period from 1 up to 200. You are not restricted to "EMA 9 and EMA 21" or any other preset pairing — pick whichever pair best matches the market you trade.

6. Full Signal Configuration

The Full signal is the confirmed crossover — the one that fires only when the crossover has occurred and all enabled validation and filter layers have agreed.

  • Full Fast MA — the fast moving average for the Full cross.

  • Full Slow MA — the slow moving average for the Full cross.

You can run a completely different MA pair here than you use for Early, which means you can build a two-stage system: an aggressive Early pair that gets your attention, and a stricter Full pair that confirms the trade.

7. Signal Timing

This is one of the most important settings in the entire indicator, and it deserves careful attention.

  • Intrabar — signals are detected on the live, still-forming candle. The fastest detection but the noisiest — the candle can still change. Alerts fire, but no arrows are drawn in this mode, by design.

  • On Close of Cross Candle — the default. Signals are detected only after the crossover candle has closed. Arrows are drawn. No repainting.

  • One Candle After Close — the strictest mode. The crossover must have occurred on the previous closed candle and the relationship must still hold on the current closed candle. This eliminates false crosses that immediately reverse.

Image A2—Screenshot showing the indicator's MA crossover input section on the indicator's menu.

8. The MA Validation Order — the heart of the indicator

This is where the indicator leaves every other crossover tool behind. There are two identical sections in the inputs:

  • Early Signal :: MA Validation Order (Buy)

  • Full Signal :: MA Validation Order (Buy)

Each contains the full MA library (every EMA, WMA, and SMA from period 1 up to 200). For each MA you get two inputs: an Enable checkbox and a Position number.

How the position numbering works

  1. You enable the MAs you want to use — say, EMA 14, EMA 5, EMA 25, and EMA 50.

  2. You assign each one a position number. The number is not the MA period — it is the slot that MA occupies in your validation stack. You are telling the indicator which MA is the strongest leg of your setup, which is second, and so on.

  3. When a candidate crossover fires, the indicator collects the current values of every enabled MA, sorts them by the positions you assigned, and checks whether the sorted values are in the exact order you described:

    • Buy signal — values must be in strictly descending order. The MA in the top slot must currently have the highest value, the next slot the next-highest, and so on.

    • Sell signal — the same check in reverse: strictly ascending order.

  4. If the order does not match exactly, the signal is rejected. No arrow, no alert.

A concrete example

You want a bullish stack to look like this on the chart:

text

EMA 14 (top — highest value) EMA 5 EMA 25 EMA 50 (bottom — lowest value)

You also want the early crossover to be 1SMA crossing 2 SMA  upwards for bullish  signal and 1EMA crossing 2EMA upwards for full confirmation signal.

You would set:

MA Enable Position
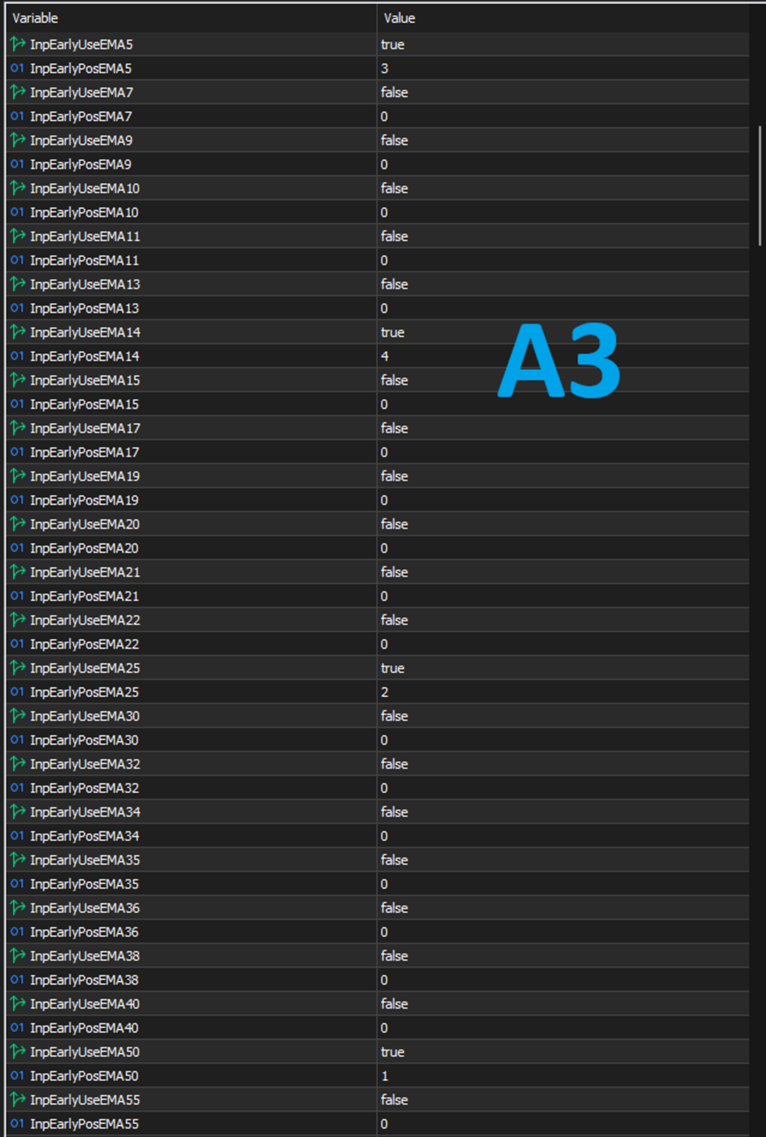
EMA 14 yes 4
EMA 5 yes 3
EMA 25 yes 2
EMA 50 yes 1

The indicator sorts these by position, giving [EMA 14, EMA 5, EMA 25, EMA 50] . For a Buy signal it then requires:

MA Order => EMA 14 > EMA 5 > EMA 25 > EMA 50

If that chain holds at the moment of the crossover, the Buy is valid. If EMA 14 pokes above EMA 5, or EMA 25 above EMA 14, the signal is discarded.

Image A3 — showing the indicator's MA validation ordersettings input section on the indicator's menu.

Image A6 — showing how the given example above would look like for a bearish signal. The thick dark blue line at the top is the 50 EMA and the blue aqua line following beneath it is the 25 EMA, followed by 5 EMA which is a thin white line then lastly followed by 14 EMA which is the yellow line. The green and purple lines crossing each other are 1 EMA and 2 EMA respectively. There aren't any visible moving averages on the chart representing 1 SMA and 2 SMA.

Note: If you want to include the moving averages involved in the crossover on the MA validation order section, you can but only the Slow MA, if you include the fast MA asa well, the logic would not work.

Why this matters

Two-MA crossover indicators fail in one specific way: they generate signals in choppy, non-trending conditions where the two MAs tangle and cross repeatedly. By requiring a full stack of MAs to line up at the same moment, this indicator refuses to fire in those conditions.

You are effectively saying: "Only tell me about crossovers that happen when the market structure supports them."

Because you can enable up to ten or more MAs — from the 1-period SMA to the 200-period EMA — the depth of validation is entirely up to you. Some traders use two MAs for a fast, loose filter. Others use eight or nine for an extremely strict one.

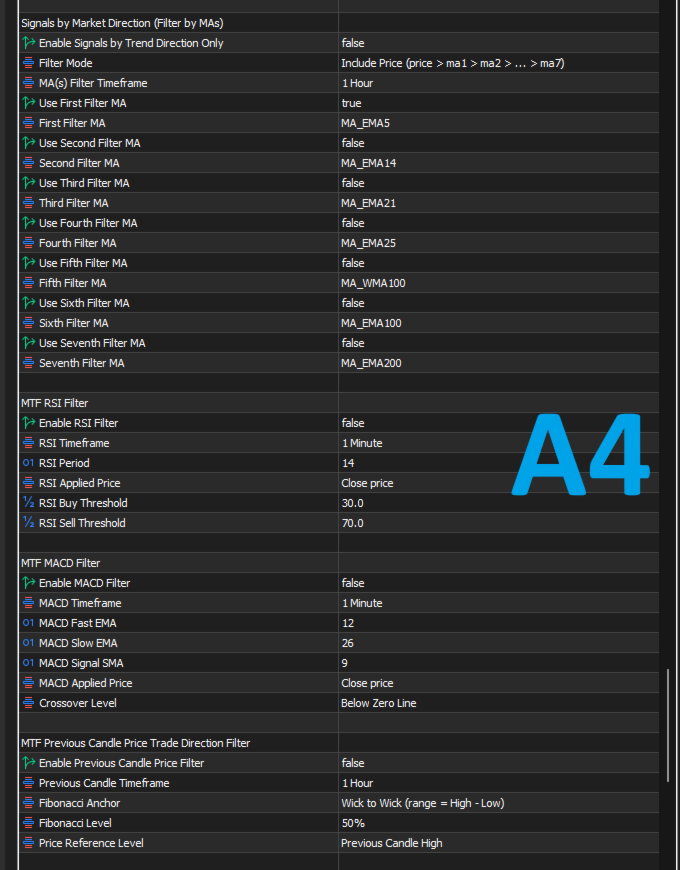
9. Signals by Market Direction (Filter by MAs)

This is the higher-timeframe trend filter. It is separate from the validation stack above — validation checks the current timeframe, this checks another timeframe.

  • Enable Signals by Trend Direction Only — on/off.

  • Filter Mode — Include Price (chains Price > MA1 > MA2 > ... > MAn for buys) or MA Only (chains MA1 > MA2 > ... > MAn , ignoring price).

  • MA(s) Filter Timeframe — the timeframe the filter MAs are evaluated on. Set this to whatever higher timeframe defines your trend.

  • Use First through Seventh Filter MA — up to seven filter MAs, each with its own enable checkbox and MA type.

If you trade M5 but want to only take signals in the direction of the H1 trend, set the filter timeframe to H1, enable two filter MAs (say EMA 50 and EMA 200), and use MA Only mode. Every signal from your M5 engine is now checked against H1 first. If H1 says down and your signal is a buy, it is silently discarded.

10. MTF RSI Filter

The same principle applied to momentum.

  • Enable RSI Filter — on/off.

  • RSI Timeframe — RSI is evaluated on a completely different timeframe from your chart.

  • RSI Period, RSI Applied Price — standard RSI configuration.

  • RSI Buy Threshold — Buy signals pass only if RSI is at or below this level (default 30).

  • RSI Sell Threshold — Sell signals pass only if RSI is at or above this level (default 70).

11. MTF MACD Filter

  • Enable MACD Filter — on/off.

  • MACD Timeframe, MACD Fast, MACD Slow, MACD Signal, MACD Applied Price — standard MACD configuration on any timeframe.

  • Crossover Level — Below Zero (momentum reversal from a low) or Above Zero (continuation in an established trend).

12. MTF Previous Candle Price Trade Direction Filter

This filter implements what is often called the one-candle theory — a single completed higher-timeframe candle is enough to define a tradable range for the session or day. After a strong directional candle, price often retraces back into it before the trend continues. Wait for the retracement, and accept a crossover only when it fires inside a specific area of that candle, and you get an entry with natural context and a natural invalidation point.

The filter is off by default. When enabled, it becomes the final arbiter: any signal that does not fit inside the range you have defined is silently discarded, no matter how many other filters agreed.

The elements you configure

1. Previous Candle Timeframe — the timeframe whose most recently closed candle defines the reference. Typically H4, D1, or W1. Must be higher than your chart timeframe; a lower setting is blocked on load with a clear error message.

2. Fibonacci Anchor — which part of the previous candle defines the 0% and 100% boundaries of the Fibonacci grid:

  • Wick to Wick — from the candle's High (100%) down to its Low (0%). Wicks included.

  • Body to Body — from the top of the body (100%) down to the bottom (0%). Wicks ignored. Useful when the previous candle had unusually long wicks, since it compresses the levels into the meaningful part of the candle.

3. Fibonacci Level — the retracement level price should reach before a crossover is accepted:

Level Meaning
23.6% Shallowest retracement
38.2% Moderate
50.0% Mid-candle
61.8% Deep
78.6% Very deep
100.0% Full retracement to the opposite extreme
107.0% Sweep past the opposite extreme — the stop-hunt zone

The 107% level exists for a specific reason. Many traders place stop losses just below the low of a bullish candle, or just above the high of a bearish candle. Price frequently spikes through those levels to trigger stops, then reverses and resumes the trend. If you want to catch that move, 107% is the level to select.

4. Price Reference Level — the second boundary of the acceptance zone, taken from the previous candle's actual OHLC: Open, High, Low, or Close.

The Fib level and the Reference level together define a zone. The crossover must occur with price inside that zone.

How the zone is built

Two prices are extracted from the previous candle:

  • Fib Price — the value of your chosen Fibonacci level across the anchor.

  • Reference Price — the value of your chosen OHLC level.

The zone is the range between those two prices, sorted so it is always well-defined.

  • Buy signal: the previous HTF candle must be bullish. Zone runs between the Fib level and the Reference level.

  • Sell signal: the previous HTF candle must be bearish. Same construction, mirrored.

If the previous candle's direction does not match the signal, the signal is rejected before the zone is even computed.

Worked examples

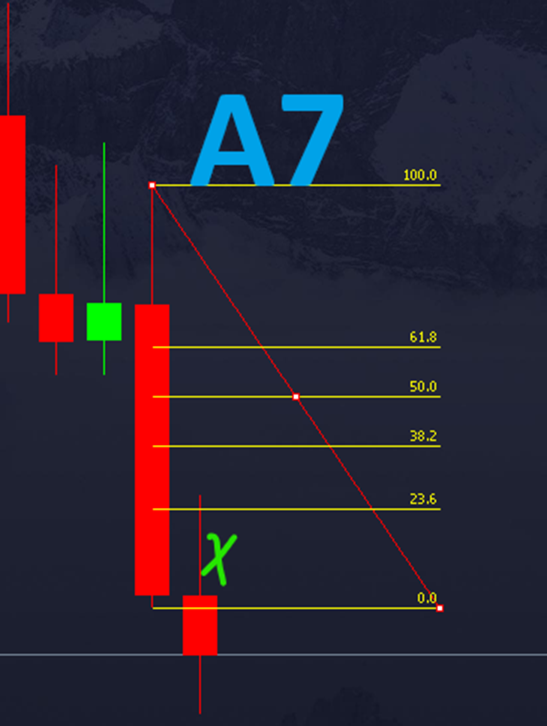
Look at the reference image A7. The bearish previous candle is the large red body on the left. The Fibonacci grid is drawn from the 100% line at the top (high) to the 0% line at the bottom (low). The blue X marks the exact crossover point — it fired inside the 23.6% level of the previous bearish candle. Because the previous candle was bearish and the signal was a sell that occurred inside the retracement zone, the filter accepted it. The green X below shows where a subsequent signal would have been rejected — price had already broken past the 23.6% level, so the retracement was spent.

The rule that surprises people — dips are forgiven

This is the single most important thing to understand about this filter.

The check is evaluated only at the moment of the crossover. Past price action within the current period does not disqualify a signal.

If you are new to this one-candle trading method, here is a practical starting point. If you choose the H4 candle as your reference, pair it with the 1-minute timeframe for the crossover signals. If you choose the D1 candle as your reference, pair it with the 15-minute timeframe for the crossover signals. If you choose the W1 candle as your reference, pair it with the H4 timeframe for the crossover signals. These pairings are a starting point, not a rule. You are free to combine any higher-timeframe reference candle with any lower timeframe for the crossover signals — whatever best fits the market you trade and the pace at which you like to work. But if you have never tried this method before, the combinations above are a good place to begin exploring it.

Image A4 — showing the indicator's MTF signals filter on the indicator's menu.


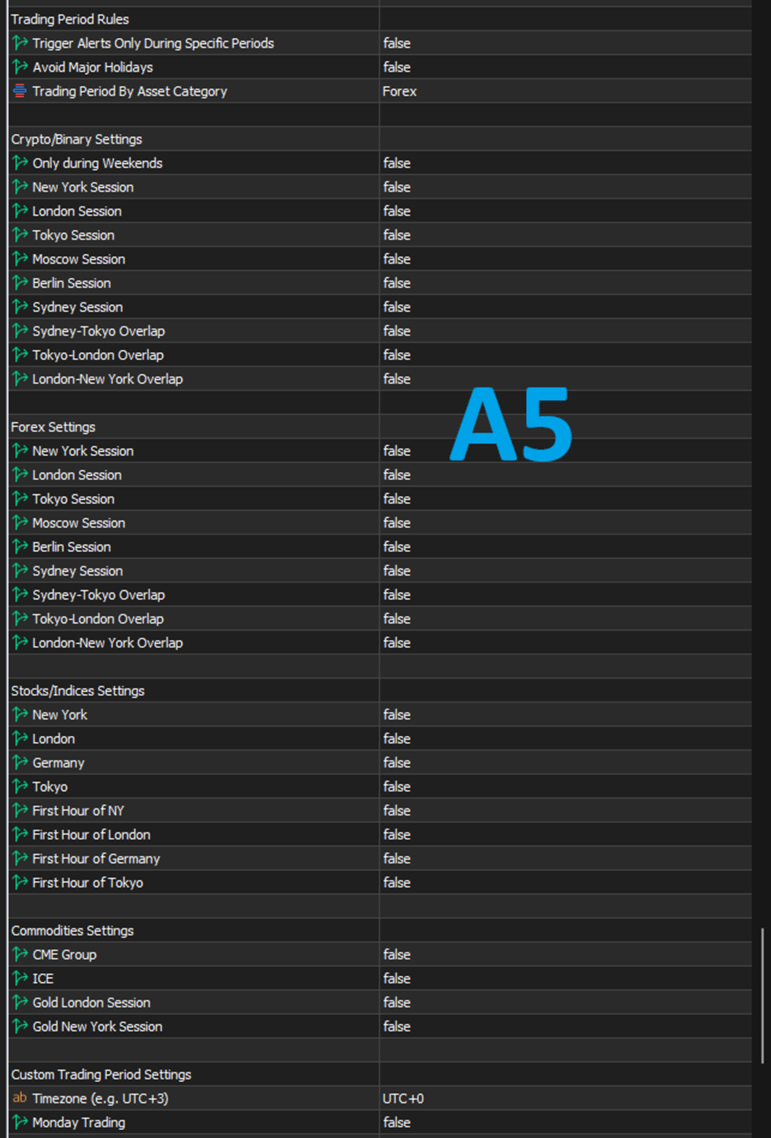
13. Trading Period Rules

Restrict signals to specific hours — London session, the first hour of the New York open, and so on.

  • Trigger Alerts Only During Specific Periods — master on/off.

  • Avoid Major Holidays — suppresses signals during New Year, Christmas, US Independence Day, and US Thanksgiving.

  • Trading Period By Asset Category — pick the category that matches your instrument:

    • Crypto / Binary — including a weekends-only option.

    • Forex — New York, London, Tokyo, Moscow, Berlin, Sydney sessions, plus three overlap periods (Sydney–Tokyo, Tokyo–London, London–New York).

    • Stocks / Indices — NYSE, LSE, FWB, and TSE hours, plus first-hour-after-open filters.

    • Commodities — CME, ICE, London Gold, and New York Gold sessions.

    • Custom — your own day-by-day schedule with a timezone offset, start hour, and end hour per day.

How to combine the layers

The real strength of this indicator is not any single filter. It is that all the filters are independent and composable. You decide how strict you want to be.

A simple configuration looks like this:

  • Multiple MAs in the validation stack (say four or five).

  • On Close timing.

  • Everything else off.

You will get more signals, filtered primarily by the MA structure.

A strict configuration looks like this:

  • Six or more MAs in the validation stack.

  • One Candle After Close timing.

  • Trend filter on H4 using two MAs.

  • RSI filter on M15 with default thresholds.

  • Previous candle filter on H1 at the 50% level.

  • Trading periods restricted to London and New York.

You will get very few signals. Every one of them will have passed every single layer you turned on.

The indicator does not force a particular trading style on you. It gives you the building blocks and lets you assemble the combination that matches the way you actually trade.

Image A5 — showing the indicator'ssignal filter section by trading period rules on the indicator's menu.

Part Four — What you receive, and what to expect

  • A clean chart. All signals are drawn as non-repainting arrows on closed bars (except in Intrabar mode, where arrows are deliberately suppressed). Your chart remains uncluttered enough to draw trendlines and load other indicators alongside this one.

  • Multi-channel alerts. Pop-up, sound, email, and mobile push are all available, independently configurable.

  • No repainting in On-Close and Confirmed modes. Once an arrow is drawn, it stays drawn.

  • Cross-instrument compatibility. The indicator works on any instrument MetaTrader 5 supports — forex pairs, metals, indices, commodities, and crypto — on any timeframe.

  • Full input documentation. Every input in the properties window carries a descriptive label, so you can configure it without constantly referring back to a manual.

Who this is for

This tool is designed for the trader who has already realized that more signals is not the same as better signals. If you have tried plain crossover indicators and found yourself scrolling back through history thinking "why did it fire there?" — this indicator was built to answer that question.

It is not a strategy in itself. It does not tell you where to place your stop loss or how much size to take. What it does is filter a common, well-understood signal type through the context that determines whether the signal is meaningful — and give you the option to make that filter as tight as you want.

Set it loose if you want a broad view of the market. Set it strict if you want a shortlist of setups that agree with every condition you care about. Either way, you are in control of the process, and the indicator is transparent about every signal it either accepts or rejects.
Produits recommandés
Calmer chart context, kept practical Northstar Flow Candles MT5 is a chart-window indicator that presents Heikin Ashi candles with a five-state trend context. It is designed for traders who want a quieter view of price while keeping the native chart available as an optional reference. Visual-only indicator: Northstar Flow Candles MT5 does not place trades and does not send popup, push, or email notifications. What appears on the chart Five candle states: strong bullish, bullish, balanced, bearis
FREE
Girassol Sunflower MT5 Indicator
Saullo De Oliveira Pacheco
3.86 (7)
This is the famous Sunflower indicator for Metatrader5. This indicator marks possible tops and bottoms on price charts. The indicator identifies tops and bottoms in the asset's price history, keep in mind that the current sunflower of the last candle repaints, as it is not possible to identify a top until the market reverses and it is also not possible to identify a bottom without the market stop falling and start rising. If you are looking for a professional programmer for Metatrader5, please

FREE
​ ️️️CandleIntelligence MTF MA Combined Pro v3.22 ️️️ - Professional Japanese Candlestick Analysis System What Is This Indicator? CandleIntelligence MTF MA Combined Pro is an advanced educational tool combining candlestick pattern analysis with Moving Average context across multiple timeframes. The indicator recognizes 11 key Japanese candlestick formations and presents them in the context of market trend, Swing High/Low levels, and position relative to moving averages. Main Features
FREE
High Low Open Close
Alexandre Borela
4.98 (45)
Si vous aimez ce projet, laissez un examen 5 étoiles. Cet indicateur tire les prix ouverts, élevés, bas et de fermeture pour les prix spécifiés période et il peut être ajusté pour un fuseau horaire spécifique. Il s ' agit là d ' un niveau important qui s ' intéresse à de nombreux domaines institutionnels et professionnels. traders et peut être utile pour vous de connaître les endroits où ils pourraient être plus active. Les périodes disponibles sont les suivantes : Jour précédent. Semaine pré
FREE
Market Sessionsync** is a cutting-edge trading session indicator designed to enhance your trading experience by visually breaking down the market's daily rhythm. With a compact window overlaid on your chart, this indicator provides a split-second understanding of the current trading session through: Basic setup: Set Difference between your local time and your broker time , set DST(Daylight Saving Time) ON or OFF , set timescale sync you want to use (Local, Broker, CET) - A vertical time marker
FREE
Show Pips for MT5
Roman Podpora
4.5 (32)
Cet indicateur d'information sera utile pour ceux qui veulent toujours être au courant de la situation actuelle du compte. VERSION MT 4 -   More useful indicators L'indicateur affiche des données telles que le profit en points, en pourcentage et en devise, ainsi que le spread pour la paire actuelle et le temps jusqu'à la fermeture de la barre sur la période actuelle. Il existe plusieurs options pour placer la ligne d'information sur le graphique : À droite du prix (passe derrière le prix) ; En c
FREE
DeMarker Advanced Indicator for MetaTrader 5 The DeMarker (DeM) indicator, created by legendary trader Tom DeMark, is a powerful oscillator designed to measure the demand for an asset by comparing recent price highs and lows. It excels at identifying potential trend exhaustion and imminent market turning points. The DeMarker Advanced Indicator for MetaTrader 5 takes this classic tool and supercharges it. While the standard DeM indicator is often difficult to read due to erratic movements, thi
FREE
My Candle Patterns
Francisco Gomes Da Silva
5 (1)
Cet indicateur est une version de démonstration de My Candle Complete, qui peut être téléchargée ici : Candle Patterns Creator Avec la version complète, vous pouvez créer vos propres règles de chandeliers et modifier les motifs de chandeliers traditionnels pour les rendre plus précis selon votre stratégie. L'indicateur comprend plusieurs exemples de règles de chandeliers, mais je vais ici en présenter seulement quelques-unes : Pattern Rule Candle Green C > O Candle Red C < O Doji C = O Hammer (C
FREE
PROMETHEUS TECHNICAN VERSION Free | By THE SONS A gift from The Sons — no strings, no trial, no expiry. Every trader deserves access to professional-grade market intelligence. That belief is why Prometheus Technical Version exists, and why it costs nothing. Consider it our handshake to the trading community. What You're Getting This is not a simplified tool dressed up as a gift. Prometheus Technican Version is a fully built, institutional-quality technical analysis indicator running a dual-model
FREE
The Bull DCA DowJones Signal – Premium Trend & Swing Indicator (WinWiFi Robot Series) Overview: Unlock the full potential of Index trading with the latest innovation from the WinWiFi Robot Series . "The Bull DCA DowJones Signal" is a precision-engineered indicator designed to conquer global Indices, Energy, and Forex markets. Optimized for the H4 Timeframe , this tool filters out market noise and delivers clear, actionable signals for Trend Following, Breakouts, and Pullbacks. Key Features & S
FREE
SC MTF Rsi MT5
Krisztian Kenedi
5 (7)
Indicateur d'Indice de Force Relative (RSI) avec support multi-timeframe, signaux visuels personnalisables et système d'alertes configurable. Services de programmation freelance, mises à jour et autres produits TrueTL sont disponibles sur mon profil MQL5 . Les retours et avis sont très appréciés ! Qu'est-ce que le RSI ? L'Indice de Force Relative (RSI) est un oscillateur de momentum qui mesure la vitesse et l'ampleur des variations de prix. L'indicateur oscille entre 0 et 100, comparant l'amp
FREE
LT Donchian Channel
Thiago Duarte
4.86 (7)
Donchian Channel is an indicator created by Richard Donchian. It is formed by taking the highest high and the lowest low of the last specified period in candles. The area between high and low is the channel for the chosen period. Its configuration is simple. It is possible to have the average between the upper and lower lines, plus you have alerts when price hits one side. If you have any questions or find any bugs, please contact me. Enjoy!
FREE
The Horse DCA Signal
Nirundorn Promphao
5 (1)
The Horse DCA Signal 1.26 – สุดยอดนวัตกรรมอินดิเคเตอร์สำหรับการเทรดทองคำและทุกสินทรัพย์ The Horse DCA Signal คืออินดิเคเตอร์รุ่นล่าสุดจากตระกูล WinWiFi Robot Series ที่ได้รับการออกแบบมาเพื่อยกระดับการเทรดบนแพลตฟอร์ม MT5 โดยเฉพาะ โดยเป็นการผสมผสานอัจฉริยะระหว่างกลยุทธ์ Follow Trend และ Scalping เข้าด้วยกันอย่างลงตัว คุณสมบัติเด่น: ระบบลูกศรแยกประเภทชัดเจน: ลูกศรสีทอง: บ่งบอกสภาวะตลาดช่วง Sideway เหมาะสำหรับการเทรดแบบ Swing Trade หรือ Scalping เก็บกำไรระยะสั้น  (2) ลูกศรสีน้ำเงินและสีแดง: บ่งบอกส
FREE
Daily Entry M1 – Indicateur MT5 Daily Entry M1 est un indicateur MetaTrader 5 conçu pour les traders qui se concentrent sur les opportunités intrajournalières à court terme sur l’unité de temps M1. L’indicateur analyse les conditions du marché et affiche des flèches BUY et SELL claires directement sur le graphique lorsque ses conditions internes d’entrée sont confirmées. L’indicateur est conçu pour rechercher des zones potentielles de retournement du marché et tente d’identifier des entrées pro
FREE
VolumeBasedColorsBars
Henrique Magalhaes Lopes
VolumeBasedColorsBars — Free Powerful Volume Analysis for All Traders Unlock the hidden story behind every price bar! VolumeBasedColorsBars is a professional-grade, 100% FREE indicator that colorizes your chart candles based on real, adaptive volume analysis. Instantly spot surges in market activity, identify exhaustion, and catch the moves that matter. This indicator gives you:    • Dynamic color-coded bars for instant volume context    • Adaptive thresholds based on historical, session-awar
FREE
Master Weis
Leonel Alberto Jose Quintana
Master Waves pour MetaTrader 5 Description Master Waves est un indicateur technique développé pour MetaTrader 5 qui organise le volume en vagues de mouvement du prix. L'indicateur analyse la direction de chaque bougie et accumule le volume tant que le mouvement reste dans la même direction. Lorsqu'un changement de direction se produit, une nouvelle vague commence. Les vagues sont affichées sous forme d'histogramme dans une fenêtre séparée. Les vagues associées aux mouvements haussiers et baissie
FREE
Liminal CMS
Elijah Scisor Garaz
LIMINAL CSM — Contrast State Modelling Indicator for MetaTrader 5 LIMINAL CSM is a regime-detection indicator that measures the contrast between currency states rather than raw momentum — quantifying the delta between strengthening and weakening pairs to produce a normalised score (0–100) that defines the current market regime before a move fully develops. At its core, CSM combines three proprietary sub-measurements: Variance-of-Variance (VoV) — how unstable volatility itself is; Momentum-Price
FREE
Free automatic Fibonacci is an indicator that automatically plots a Fibonacci retracement based on the number of bars you select on the BarsToScan setting in the indicator. The Fibonacci is automatically updated in real time as new highest and lowest values appears amongst the selected bars. You can select which level values to be displayed in the indicator settings. You can also select the color of the levels thus enabling the trader to be able to attach the indicator several times with differe
FREE
Follow The Line MT5
Oliver Gideon Amofa Appiah
4.6 (35)
This indicator obeys the popular maxim that: "THE TREND IS YOUR FRIEND" It paints a GREEN line for BUY and also paints a RED line for SELL. (you can change the colors). It gives alarms and alerts of all kinds. IT DOES NOT REPAINT and can be used for all currency pairs and timeframes. Yes, as easy and simple as that. Even a newbie can use it to make great and reliable trades. NB: For best results, get my other premium indicators for more powerful and reliable signals. Get them here: https://www.m
FREE
Donchian Breakout And Rsi
Mattia Impicciatore
4.5 (2)
Description générale Cet indicateur est une version améliorée du Canal Donchian classique, enrichie de fonctionnalités pratiques pour le trading réel. En plus des trois lignes standard (supérieure, inférieure et ligne médiane), le système détecte les cassures et les affiche visuellement avec des flèches sur le graphique, en montrant uniquement la ligne opposée à la direction actuelle de la tendance pour une lecture plus claire. L’indicateur comprend : Signaux visuels : flèches colorées lors des
FREE
How it works –   Base-departure detection — algorithmically finds consolidation bases (overlapping range with compressed volatility) followed by displacement departures. Patterns: Drop-Base-Rally, Rally-Base-Drop, Rally-Base-Rally, Drop-Base-Drop — detected structurally, not by candle names. –   Strength score (0–100) — from departure velocity, time-at-base, freshness (each revisit decays the score), higher-timeframe confluence and origin volume. –   Lifecycle — Fresh, Tested (decaying), Broken
FREE
Friend of the Trend: Your Trend Tracker Master the market with Friend of the Trend , the indicator that simplifies trend analysis and helps you identify the best moments to buy, sell, or wait. With an intuitive and visually striking design, Friend of the Trend analyzes price movements and delivers signals through a colorful histogram: Green Bars : Signal an uptrend, indicating buying opportunities. Red Bars : Alert to a downtrend, suggesting potential selling points. Orange Bars : Represent cons
FREE
Lignes de tendance automatiques à travers les swings du marché — toujours à jour, sans retracé manuel. • Rayons passant par les deux derniers swing highs et les deux derniers swing lows, plus une ligne médiane optionnelle entre eux. • Longueur de swing réglable, ligne de connexion activable, étiquettes de structure. • Modes de mise à jour : à la clôture de la bougie HTF, à la clôture de la bougie du graphique, ou à chaque tick. • Multi-timeframe : des lignes de tendance de plusieurs TF sur un mê
FREE
Volume Proxy
Giorgi Abuladze
Volume Proxy A synthetic order flow indicator for CFD traders on XAUUSD, NAS100, and US30. --- What It Does CFD and synthetic markets on MetaTrader 5 do not provide real volume data. The standard tick volume that most traders rely on only counts price updates — it reveals nothing about the actual buying and selling pressure behind a move. This leaves retail traders unable to distinguish genuine institutional activity from ordinary market noise. Volume Proxy addresses this directly. It synthesi
FREE
Reversal Composite Candles
MetaQuotes Ltd.
3.69 (16)
The idea of the system is to indentify the reversal patterns using the calculation of the composite candle. The reversal patterns is similar to the "Hammer" and "Hanging Man" patterns in Japanese candlestick analysis. But it uses the composite candle instead the single candle and doesn't need the small body of the composite candle to confirm the reversal. Input parameters: Range - maximal number of bars, used in the calculation of the composite candle. Minimum - minimal size of the composite can
FREE
My other indicators: https://www.mql5.com/en/market/product/156702 (FREE) https://www.mql5.com/en/market/product/153968 (FREE) https://www.mql5.com/en/market/product/153960 (FREE) This indicator displays higher timeframe candles directly on your lower timeframe chart, allowing you to monitor higher timeframe price action without switching between charts. It also plots session highs and lows for the Asia, London, and New York kill zones, giving you key liquidity levels directly on your chart. Wh
FREE
VFI Quantum
Nikita Berdnikov
5 (1)
Introducing VFI (Volume Flow Indicator) – a trading indicator that analyzes the relationship between volume and price movement to identify key trading opportunities. The indicator displays the strength and direction of volume flow, providing clear signals about potential entry and exit points. Signals are formed based on zero line crossovers, crossovers between the VFI line and its exponential moving average (EMA), and when the indicator exits overbought and oversold zones. Attention! This stra
FREE
The indicator defines the Bullish and Bearish Engulfing Bar. The pattern has greater reliability when the open price of the engulfing candle is well above the close of the first candle, and when the close of the engulfing candle is well below the open of the first candle. For an engulfing bar to be valid it must fully engulf at least one previous bar or candle - includes all the body and the wick. The engulfing bar can engulf more than one bar as long as it completely engulfs the previous bar.
FREE
SMMA Bands Indicator
Elie Baptiste Granger
The SMMA Bands indicator is an advanced volatility-based trading tool that creates 6 dynamic support and resistance levels around an envelope formed by two Smoothed Moving Averages (SMMA).  This indicator combines the reliability of SMMA trend identification with the precision of standard deviation-based volatility bands, making it suitable for both trend-following and mean-reversion strategies. Every band has its own buffer for use in EA. feel free to make suggestions and add reviews , i will
FREE
Easy GOLD MT5
Franck Martin
3.87 (45)
Easy Gold is the latest addition to the BotGPT family. It is surprising and very powerful. It is ideal for beginners due to its simplicity.  There is absolutely nothing to do, it's 100% automated, simply indicate the percentage of risk you want to take per trade and the EA is ready. Whatever your capital, the EA takes care of everything. Optimized on (XAUUSD).  Unleash all the power with the professional version (AGI Gold) and its connection to the neural network, available in my store. My othe
FREE
Les acheteurs de ce produit ont également acheté
SMART TREND TRADING SYSTEM — OFFRE SPÉCIALE Votre système de trading. Votre EA d’automatisation. Votre formation et votre accompagnement. Achetez Smart Trend Trading System pour MT5 à 99 USD et recevez Smart Universal Expert Advisor GRATUITEMENT pour automatiser ses signaux. STTS réunit la direction de la tendance, les signaux d’entrée et de sortie, les zones de retournement et les niveaux de prix importants directement sur votre graphique. Suivez le système manuellement ou connectez l’EA inclus
Trend Sniper X
Sarvarbek Abduvoxobov
4.9 (39)
Trend Sniper X est un indicateur de suivi de tendance multi-unités de temps pour MetaTrader 5 qui aide les traders à identifier la direction de la tendance et les points d'inversion potentiels avec clarté et précision. pour MT4: https://www.mql5.com/en/market/product/193245 Informations sur le prix : Le prix actuel est un prix promotionnel et est susceptible de changer lors des prochaines mises à jour et nouvelles fonctionnalités. Offre bonus : Pour obtenir GRATUITEMENT l'Auto-Trade Assistant E
Neuro Poseidon MT5
Daria Rezueva
4.75 (53)
Neuro Poseidon is a new indicator by Daria Rezueva. It combines precise trading signals with adaptive TP/SL levels - creating best possible trades as a result! Message me and get  Neuro Poseidon Assistant  as a gift to automize your trading process! What makes it stand out? 1. Proven profitability on all assets and timeframes 2. Only confirmed BUY and SELL signals present on the chart 3. Adaptive TP & SL levels generated by the software for each trade 4. Easy to understand - suitable for al
Unix Scalper
Issam Kassas
5 (3)
UNIX SCALPER — OFFRE SPÉCIALE Repérez la configuration. Consultez le plan. Choisissez comment intervenir. Achetez UNIX Scalper pour MT5 à 99 USD et recevez Smart Universal Expert Advisor GRATUITEMENT pour automatiser ses signaux. UNIX Scalper réunit l’analyse du marché, les décisions BUY/SELL/WAIT et les niveaux Entry, Stop Loss, TP1 et TP2 dans un panneau organisé. Suivez le plan de trading manuellement ou connectez l’EA inclus pour une exécution automatique selon vos paramètres. Le prix actuel
Zoryk Gold
Reda El Koutbane
5 (12)
ZORYK — Système avancé de signaux XAUUSD pour MetaTrader 5 Vous connaissez certainement cette sensation. Vous passez du temps à analyser l’or. Vous attendez le bon point d’entrée. Vous ouvrez enfin la position, puis le prix commence immédiatement à évoluer contre vous. Vous fermez trop tôt, déplacez le Stop Loss ou hésitez pendant quelques secondes. Ensuite, le marché atteint exactement l’objectif que vous aviez initialement prévu, mais sans vous dans la position. Le problème n’était pas toujour
Commençons par être honnêtes. Aucun indicateur ne vous rendra rentable à lui seul. Si quelqu’un vous dit le contraire, il vous vend un rêve. Tout indicateur qui affiche des flèches parfaites d’achat/vente peut être rendu impeccable — il suffit de zoomer sur la bonne partie de l’historique et de capturer uniquement les trades gagnants. Nous ne faisons pas cela.  SMC Intraday Formula est un outil. Il lit la structure du marché pour vous, identifie les zones de prix à la probabilité la plus élevée
SuperScalp Pro
Van Minh Nguyen
4.65 (34)
SuperScalp Pro - Professional Multi-Layer Confluence Scalping System SuperScalp Pro est un indicateur avancé de scalping qui améliore le Supertrend classique grâce à plusieurs filtres intelligents de confirmation. Il aide à identifier des opportunités de Buy/Sell présentant une probabilité plus élevée, tout en réduisant considérablement les faux signaux. Des flèches Buy et Sell claires apparaissent directement sur le graphique, tandis que les niveaux de Stop Loss et Take Profit basés sur l’ATR s
M1 Sniper MT5
Oleg Rodin
5 (7)
M1 SNIPER   est un système d'indicateurs de trading facile à utiliser. Il s'agit d'un indicateur à flèche conçu pour l'unité de temps M1. Cet indicateur peut être utilisé seul pour le scalping sur l'unité de temps M1 ou intégré à votre système de trading existant. Bien que conçu spécifiquement pour le trading sur l'unité de temps M1, ce système peut également être utilisé avec d'autres unités de temps. Initialement, j'avais conçu cette méthode pour le trading du XAUUSD et du BTCUSD. Cependant, j
Reversion King Indicator
Eugen-alexandru Zibileanu
5 (9)
Un nouveau Roi en ville - Indicateur + Gestion des ordres (TP1 + TP2 + TP3) + Envoi optionnel de signaux Telegram INCLUS (GRATUIT) (SYSTÈME COMPLET DE TRADING et DE SIGNAUX) Notre meilleur EA pour l’Or : Gold Slayer Cet indicateur inclut une stratégie avancée, un système de trading avec gestion des ordres personnalisable ainsi qu’un système de retour à la moyenne combinant des extensions d’enveloppes, soutenu par plusieurs filtres intelligents de confirmation comme le RSI afin de détecter des en
Gann Made Easy   est un système de trading Forex professionnel et facile à utiliser qui est basé sur les meilleurs principes de trading en utilisant la théorie de mr. WD Gann. L'indicateur fournit des signaux d'ACHAT et de VENTE précis, y compris les niveaux Stop Loss et Take Profit. Vous pouvez échanger même en déplacement en utilisant les notifications PUSH. VEUILLEZ ME CONTACTER APRÈS L'ACHAT POUR RECEVOIR GRATUITEMENT DES INSTRUCTIONS DE TRADING ET D'EXCELLENTS INDICATEURS SUPPLÉMENTAIRES! V
GoldenX Entry MT5
Kareem Abbas
5 (16)
GoldenX Entry est un indicateur MT5 doté d’un algorithme adaptatif Smart Entry Trend, d’un système de scoring des signaux, d’un détecteur de régime de marché et d’un filtre de volatilité. Chaque signal inclut un niveau d’entrée calculé, trois niveaux de Take-Profit (TP1, TP2, TP3) ainsi qu’un niveau de Stop-Loss. Il est construit sur plusieurs couches analytiques conçues pour s’adapter à différentes conditions de marché, combinant un système analytique multicouche avec un optimiseur intégré et u
La légende est de retour : Entry Points Pro 10. La relance de l'indicateur légendaire qui s'est maintenu 3 ans dans le Top-3 du MQL5 Market. Des centaines d'avis enthousiastes (589 sur les deux versions), des milliers de traders l'utilisent chaque jour, 31 000+ téléchargements de la démo   MT4+MT5 . J'ai lu chacun de vos avis publiés en cinq ans — et au lieu de promettre, j'ai intégré les réponses directement dans la version 10. Par un auteur présent sur les marchés depuis 1999, qui tient à l'ho
Welcome to ENTRY IN THE ZONE AND SMC MULTI TIMEFRAME Entry In The Zone and SMC Multi Timeframe is a real-time market analysis tool based on Smart Money Concepts (SMC), designed to analyze market structure, price direction, and key trading zones. It supports both Single-Timeframe Analysis and Multi-Timeframe Analysis, providing a clearer view of the overall market structure across multiple timeframes, with real-time BUY / SELL signals that do not repaint. It is designed to help filter trading opp
Gold Entry Sniper
Tahir Mehmood
5 (20)
Gold Entry Sniper – Tableau de Bord ATR Multi-Unités de Temps pour Scalping et Swing Trading sur l'Or Gold Entry Sniper est un indicateur avancé pour MetaTrader 5 qui fournit des signaux d'achat/vente précis sur XAUUSD et autres actifs, basé sur la logique de Trailing Stop ATR et l' analyse multi-unités de temps . Caractéristiques et Avantages Clés Analyse Multi-Unités de Temps – Affiche les tendances en M1, M5, M15 sur un seul tableau. Trailing Stop Basé sur l'ATR – Ajuste automatiquement selon
Tokyo mt5 Indicator
Vasiliy Strukov
5 (1)
Le Tokyo Indicator offre une vue d'ensemble visuelle et claire de l'orientation de la tendance, des signaux de trading potentiels et des conditions du marché. Sa ligne de tendance en escalier, codée par couleur, distingue les phases haussières (en bleu) des phases baissières (en magenta). Des flèches directionnelles associées mettent en évidence les opportunités d'achat et de vente potentielles lors des changements de tendance. Un tableau de bord intégré regroupe le signal actuel, l'orientation
Market Structure Order Block Dashboard MT5 est un indicateur MT5 conçu pour les traders qui veulent lire la structure de marché et les principales zones de réaction du prix directement sur le graphique. Il combine BOS, ChoCH, Order Blocks, Fair Value Gaps (FVG), Liquidité, Kill Zones, Volume Profile, et un dashboard compact pour une analyse rapide. Cet indicateur s'adresse aux traders qui utilisent la structure de marché, les concepts ICT et Smart Money comme cadre de décision. Il peut aider à r
FiboSniper Pro
Van Minh Nguyen
5 (3)
FiboSniper Pro – Multi-Filter Fibonacci System with Auto SL/TP and Control Panel FiboSniper Pro est un indicateur technique qui combine des Fibonacci Envelopes dynamiques avec plusieurs filtres de confirmation afin de générer des signaux Buy et Sell sélectionnés. Les niveaux de Fibonacci sont calculés à partir de Moving Average et ATR, puis filtrés par ADX, EMA, RSI, ATR, Volume, Time et la structure des bougies. L’indicateur affiche directement sur le graphique les niveaux automatiques de Stop
Adaptive Price Action Engine Achetez un indicateur, obtenez l'EA gratuitement Analyse auto-optimisée des tendances et des figures de chandeliers Multi-Timeframe Les marchés évoluent constamment, et tous les modèles de Price Action n’ont pas la même valeur dans toutes les conditions de marché. Adaptive Price Action Engine a été conçu pour s’adapter aux changements du marché en combinant structure de tendance, analyse Multi-Timeframe, figures de chandeliers et optimisation statistique au sein d’un
Currency Strength Wizard   est un indicateur très puissant qui vous offre une solution tout-en-un pour un trading réussi. L'indicateur calcule la puissance de telle ou telle paire de devises en utilisant les données de toutes les devises sur plusieurs périodes. Ces données sont représentées sous la forme d'un indice de devise facile à utiliser et de lignes électriques de devise que vous pouvez utiliser pour voir la puissance de telle ou telle devise. Tout ce dont vous avez besoin est d'attacher
Divergence Bomber
Ihor Otkydach
4.89 (94)
Chaque acheteur de cet indicateur reçoit également gratuitement : L’outil exclusif « Bomber Utility », qui accompagne automatiquement chaque opération de trading, fixe les niveaux de Stop Loss et de Take Profit, et clôture les positions selon les règles de la stratégie Des fichiers de configuration (set files) pour adapter l’indicateur à différents actifs Des set files pour configurer le Bomber Utility selon différents modes : « Risque Minimum », « Risque Équilibré » et « Stratégie d’Attente »
Atomic Analyst MT5
Issam Kassas
4.45 (58)
ATOMIC ANALYST — OFFRE SPÉCIALE Votre analyse de marché. Votre EA d’automatisation. Votre formation et votre accompagnement. Achetez Atomic Analyst pour MT5 à 99 USD et recevez Smart Universal Expert Advisor GRATUITEMENT pour automatiser ses signaux. Atomic Analyst réunit l’action des prix, la direction de la tendance, les signaux d’entrée et de sortie, le Stop Loss et plusieurs niveaux de Take Profit directement sur votre graphique. Tradez manuellement à l’aide de son analyse ou connectez l’EA
SMART PRICE ACTION CONCEPTS — OFFRE SPÉCIALE Observez la structure. Identifiez les zones. Construisez votre plan de trading. Achetez Smart Price Action Concepts pour MT5 à 49 USD et recevez Smart Universal Expert Advisor GRATUITEMENT. Réunissez Smart Money Concepts (SMC), analyse de style ICT et action des prix sur un graphique organisé. Identifiez la structure du marché, les blocs d’ordres, les niveaux de référence de liquidité et les déséquilibres, puis choisissez les éléments à afficher avec
Axiom Matrix
Issam Kassas
5 (8)
Axiom Matrix — OFFRE SPÉCIALE Achetez Axiom Matrix pour 49 USD et recevez Smart Universal Expert Advisor GRATUITEMENT. Explorez le marché. Comparez les configurations. Choisissez votre graphique. Axiom Matrix réunit l’analyse de plusieurs symboles et unités de temps dans un tableau de bord. Repérez où concentrer votre attention sans ouvrir chaque graphique. Analysez les symboles de l’Observation du marché ou votre sélection sur plusieurs unités de temps. Comparez tendance, momentum, volume, vola
Superhero
Ihor Otkydach
5 (3)
L'indicateur SUPERHERO est un système de trading multidevises conçu selon un principe « tout compris ». Cet indicateur analyse le marché de manière autonome et fournit des signaux indiquant quand ouvrir et clôturer des positions. Il utilise des ordres Stop Loss et Take Profit. Le rapport R:R est de 1:1. Ce système peut envoyer des notifications push sur votre smartphone, ce qui vous permet de passer des ordres « où que vous soyez », sans avoir à rester devant un ordinateur. C'est la solution idé
Volatility Master for MetaTrader is a real-time dashboard tool that scans up to  50 symbols  to identify high-volatility , trending markets instantly. With bullish/bearish signals, customizable alerts, and a user-friendly interface, it helps you avoid range-bound conditions and focus on high-probability trades. Clarity leads to confidence. Trade confidently and protect your capital effectively with this powerful dashboard. We don't offer free or bonus indicators in exchange of reviews from you.
CRT Candle Range Theory HTF MT5 - Ultimate CRT Indicator : Concepts ICT avancés et système de trading Malaysian SnR Maîtrisez les traces des Market Makers avec l'indicateur Candle Range Theory le plus avancé. Libérez la véritable puissance des Smart Money Concepts (SMC) et tradez avec la même précision que les institutions grâce à l'Ultimate CRT Indicator. Conçu exclusivement pour les traders sérieux, cet indicateur automatise la théorie CRT, un pilier central des concepts ICT (Inner Circle Trad
Power Candles MT5
Daniel Stein
4.58 (12)
Power Candles V3 - Indicateur de force à optimisation automatique Power Candles V3 transforme la force des devises et des instruments en un plan de trading exploitable sur chaque graphique auquel il est associé. Au lieu de se contenter de colorer les bougies, il effectue une optimisation automatique en temps réel en arrière-plan et vous fournit les meilleurs niveaux de Stop Loss, Take Profit et seuils de signal pour le symbole que vous avez sous les yeux. Un simple clic suffit pour l'adopter en
Trend Catcher ind mt5
Ramil Minniakhmetov
5 (18)
INDICATEUR DE DÉTECTEUR DE TENDANCE L'indicateur de détecteur de tendance analyse les mouvements de prix du marché grâce à une combinaison d'indicateurs d'analyse de tendance adaptatifs, propriétaires et personnalisés. Il identifie la véritable direction du marché en filtrant les fluctuations à court terme et en se concentrant sur la force de la dynamique sous-jacente, l'expansion de la volatilité et la structure des prix. Il utilise également une combinaison d'indicateurs personnalisés de lis
IQ FX Gann Levels a precision trading indicator based on W.D. Gann’s square root methods . It plots real-time, non-repainting support and resistance levels to help traders confidently spot intraday and scalping opportunities with high accuracy. William Delbert Gann (W.D. Gann) was an exceptional market analyst, whose trading technique was based on a complex blend of mathematics, geometry, astrology, and ancient mathematics which proved to be extremely accurate. We don't offer free or bonus indic
RelicusRoad Pro MT5
Relicus LLC
4.96 (24)
RelicusRoad Pro : Système d'Exploitation Quantitatif du Marché 70% DE RÉDUCTION ACCÈS À VIE (DURÉE LIMITÉE) - REJOIGNEZ 2 000+ TRADERS Pourquoi la plupart des traders échouent-ils même avec des indicateurs "parfaits" ? Parce qu'ils tradent des concepts isolés dans le vide. Un signal sans contexte est un pari. Pour gagner, il faut de la CONFLUENCE . RelicusRoad Pro est un Écosystème Quantitatif complet . Il cartographie la "Fair Value Road", distinguant le bruit des cassures structurelles. Arrête
Filtrer:
Aucun avis
Répondre à l'avis