 MetaTrader 5
 Experts
 Indicateurs
 Bibliothèque
 Utilitaires
 Widgets
 Règles
Regardez les tutoriels vidéo de Market sur YouTube
Comment acheter un robot de trading ou un indicateur
Exécutez votre EA sur
hébergement virtuel
hébergement virtuel
Test un indicateur/robot de trading avant d'acheter
Vous voulez gagner de l'argent sur Market ?
Comment présenter un produit pour qu'il se vende bien
Indicateurs techniques gratuits pour MetaTrader 5 - 34
 Les signaux provenant des indicateurs techniques jouent un rôle crucial dans l'ouverture et la clôture des transactions sur les marchés boursiers et les marchés forex. L'essence des indicateurs est une transformation mathématique du prix d'un symbole financier visant à prévoir les changements de prix futurs. Testez les indicateurs techniques pour mieux prédire le comportement du marché et en tirer profit.
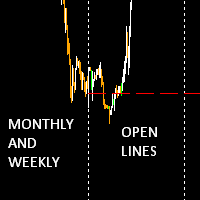
The Monthly Weekly Open Line is an indicator that plots: The current month open line that will extend till the last week on the month. Weekly lines that span the look back days period that you have set . Each line will extend from the respective weekly Monday zero GMT till friday of the respective week. Monthly and Weekly open lines can be used to build very powerfull anc consistent trading strategies. They act as natural S/R price barriers.
FREE
Introduction
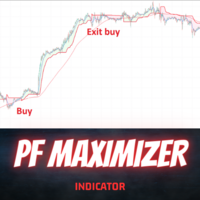
The PF Maximizer is a game-changing non-repainting technical tool engineered to help traders distinguish genuine trend signals from erratic market fluctuations. By employing sophisticated algorithms and cutting-edge data analysis, this indicator efficiently filters out unwanted noise, empowering traders to identify the precise starting and ending points of substantial market moves.
Signal
Potential buy signal is generated when moving average is going up and the blue line cross a
FREE

QuantMatrix Volatility Regime QuantMatrix Volatility Regime is a technical indicator for MetaTrader 5 that evaluates the current volatility of the selected symbol and timeframe. The indicator uses Average True Range (ATR) to compare current volatility with a historical baseline calculated from previous bars. Based on this comparison, the current market condition is classified into one of four volatility regimes: LOW – current volatility is below the historical baseline. NORMAL – current volatil
FREE

SuperSmooth MTF EMA est la version gratuite de l’indicateur de tendance SuperSmooth EMA pour MetaTrader 5. Il permet aux traders de découvrir l’algorithme SuperSmooth EMA et d’analyser la direction du marché à l’aide d’une moyenne mobile particulièrement fluide et stable. Contrairement aux moyennes mobiles traditionnelles, la SuperSmooth EMA utilise une méthode de lissage spéciale où le calcul EMA est appliqué plusieurs fois. Cette approche réduit efficacement le bruit du marché tout en restant
FREE
Koryu Delta Koryu Delta est un indicateur MetaTrader 5. Il identifie les points de retournement de tendance grâce à l'analyse des points pivots et aux données de volume delta. Il détecte les figures de Market Shift et affiche des signaux basés sur la dynamique du marché. Cet outil est adapté aux traders pratiquant le scalping, le swing trading ou l'investissement à long terme. Il analyse jusqu'à 500 barres historiques pour identifier les figures passées. Il utilise la logique de barres fermées
FREE

ICT Levels Pro is a complete multi-timeframe levels indicator for MT5, built for traders who follow ICT methodology. Every key level is plotted automatically and labeled clearly — Daily, Weekly, Monthly, ADR, AWR, and Open Range — all in one indicator with full individual control over every single line.
DAILY LEVELS
- PDH — Previous Day High - PDL — Previous Day Low - DO — Daily Open - TDO — True Day Open (NY midnight price)
FREE

PivotScannerPro — Multi-Symbol Multi-Timeframe Pivot & EMA Scanner PivotScannerPro is a free, all-in-one dashboard that scans multiple symbols across multiple timeframes at once — so you can spot trade opportunities without opening dozens of charts. Built by the community, for the community. WHAT IT DOES The scanner shows a clean dashboard with every symbol on the left and your chosen timeframes (M15 / H1 / H4 / D1) across the top. Each cell tells you three things at a glance: SIGNAL — a fresh B
FREE

GoGo Breaker – The Master Candle Signal Signaux intelligents basés sur l'action des prix avec des filtres avancés GoGo Breaker est un puissant indicateur de trading qui utilise le modèle "Master Candle" pour identifier en temps réel des opportunités à haute probabilité. Conçu pour les traders recherchant des entrées rapides et précises , il est idéal pour le scalping, l'intraday et le swing trading . Détecte automatiquement les signaux d'achat/vente avec des flèches claires. Fonctionne sur tous
FREE

Pinpoint Level is the indicator for Day Traders and Scalpers. Developed to deliver precision when entering or exiting trades without the need for manual configuration. Just drag it onto the chart and it will instantly map the most critical price zones for the current session. Ideal for Forex, Indices, and Cryptocurrencies, it automatically calculates the previous day's range and projects exact Fibonacci-based Support and Resistance expansions, keeping your chart clean and your focus on what mat
FREE
L’ Indicateur Linear Regression Candles est un outil avancé qui améliore l’analyse traditionnelle des chandeliers grâce à l’utilisation de techniques de régression linéaire. Il permet aux traders de mieux visualiser les tendances du marché en réduisant le bruit et en lissant les mouvements des prix. Contrairement aux chandeliers classiques, les chandeliers de régression linéaire sont calculés dynamiquement sur la base d’une régression statistique, offrant une vue plus claire de la direction d
FREE

Jackson Support and Resistance V it a powerful advance support and resistance indicator which provide signal base on price action, it Design to make things easy for everyone to draw support and resistance. we believe most strategies are built with support and resistance as a foundation .Having support and resistance perfect can be a game change to you way of trading. It flexible to all instrument .don't forget to watch our video on how to us this indicator prefect and progressive.
FREE

Trend magic indicator uses cci and atr to create buy and sell in the market . this a a line that changes its color when any of the conditions occur ie buy and sell . I find the indicator given you a bit of a better entry when you change the parameters to CCI=20, ATR=100, ATR MULTIPLIER= 2.
Set up entry just above the indicatror afetr a retracement. Set your stop loss a 20 cents to a dollar (depending on share size) below your entry. Be ready to enter a new position above indicator again if you
FREE
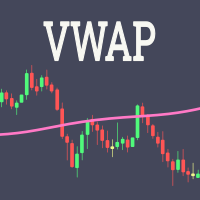
Fundamentação teórica A VWAP é uma média móvel ajustada pelo volume, ou seja o peso de cada preço corresponde ao volume de ações negociadas no período, dando mais importância ao período em que se tenha mais negociações. [1] VWAP = sum(price[i]*volume[i]) / sum(volume[i]) Metodologia É possível configurar o período que será utilizado para o calculo da VWAP, a cor, a espessura e o estilo da linha. A linha é desenhada desde a o começo da série disponível apenas uma vez para economizar recursos com
FREE

Williams Fractal El Clásico El Williams Fractal es uno de los indicadores técnicos más reconocidos y utilizados en el análisis del mercado. Su objetivo es identificar automáticamente los máximos y mínimos fractales , resaltando los puntos donde el precio forma estructuras de giro potenciales. Gracias a su simplicidad y eficacia, este indicador se ha convertido en una herramienta indispensable para traders que trabajan con Price Action, Smart Money Concepts (SMC), ICT, soportes y resistencias, lí
FREE
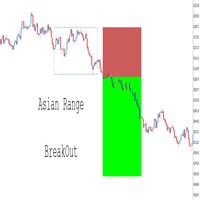
paramètres tels que le temps de range, les couleurs, les styles de ligne et les réglages risque-récompense. Visualisation des niveaux de trading – Trace automatiquement les niveaux de prix d’entrée, de stop-loss (SL) et de take-profit (TP) en fonction des conditions de breakout. Intégration fluide avec les Expert Advisors (EAs) – Prenez le contrôle total de vos stratégies automatisées en ajoutant des confirmations supplémentaires comme le RSI, les Moyennes Mobiles, la Rupture de Structure (B
FREE

Trade Behavior Mirror lit uniquement l'historique des transactions déjà clôturées de votre propre compte et compte un seul phénomène précis : l'ouverture d'une nouvelle position peu après une perte réalisée, avec un lot plus important que votre volume habituel. L'outil ne prédit rien et ne conseille rien. Chaque chiffre du panneau correspond à quelque chose qui s'est déjà produit sur ce compte.
Comment les chiffres sont construits : l'outil lit jusqu'à 31 jours de transactions clôturées, tous s
FREE

L’indicateur Break Tracer est un système de tendance sans repaint pour MetaTrader 5. Il combine trois outils de tendance indépendants en un seul indicateur visuel : une paire d’EMAs rapides (par défaut 26 / 50), une moyenne mobile de tendance à 200 périodes (EMA ou SMA, avec ancrage optionnel sur une unité de temps supérieure) et un canal basé sur l’ATR qui filtre les phases de range. Un signal directionnel n’est déclenché que lorsque les trois composants sont alignés : la bougie doit clôturer e
FREE

The Average Directional Index (ADX) is a technical analysis indicator developed by J. Welles Wilder in 1978. Its primary function is to measure the strength of a trend, regardless of its direction, and to determine whether the price has entered a sideways trend. It is also mentioned by John Murphy in *The Visual Investor* (2005) as an indicator that helps determine whether a market is ranging or is about to start a new trend. As for Exponential Moving Averages (EMAs), some authors believe that
FREE

Little useful tool - you manually select range on chart by dragging vertical blue lines and indicator shows support and resistance zones for this range and extends them outside of selected range.
Useful for:
* Range trading
* Range breakout
* Range breakout & retest
* Good entry during pullback in trend phase when previous high is retested
* Good for scalping on short timeframes
* Good for trades on longer timeframes around selected important zones like daily high or low
FREE

MACD Sniper Signals PRO
SHORT DESCRIPTION
MACD Sniper Signals PRO is a momentum-based indicator designed to deliver clear buy and sell signals through refined MACD logic, structured visual trend shifts, and alert notifications. This indicator does not repaint.
FULL DESCRIPTION
MACD Sniper Signals PRO is built for traders who require clarity, speed, and objectivity in market decision-making.
It focuses on identifying momentum transitions using an optimized MACD framework combined with real-tim
FREE
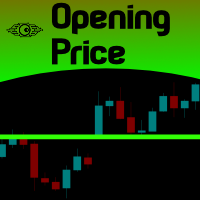
For those Price Action traders who love to trade strong Price points, like today's Opening Price (or even yesterday's Price), here is an indicator to ease the identification of those values, drawn directly on your chart! Opening Price will automatically draw a line showing you this point for you, AND, if you like any OPENing price in the past, not just today's price. A must-have in your Price Action toolbox!
SETTINGS
How many past days do you want to be drawn? Do you want to draw the current da
FREE
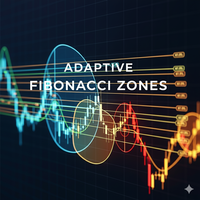
L'indicateur Adaptive Fibonacci Zones est une version améliorée et dynamique du retracement de Fibonacci classique de MetaTrader 5. Sa principale différence avec l'outil natif est que vous n'avez pas besoin de tracer manuellement les niveaux , ni de décider à l'œil de quel point à quel point mesurer le retracement. L'indicateur fait ce travail pour vous : il détecte automatiquement les swings (points hauts et points bas pertinents) du marché en utilisant des fractales et un filtre de volatilité
FREE

Precision Trend & Momentum Filter Take the guesswork out of trend trading with this highly sophisticated yet intuitive market analysis tool. Designed to identify high-probability trend, this tool combines multiple layers of market data to ensure you only enter a trade when the conditions are perfectly aligned. Instead of reacting to every minor market fluctuation, this tool acts as a strict gatekeeper. It waits for a confirmed shift in market direction, validates it against the broader trend, an
FREE

Transparent Renko Overlay Indicator Overview Transparent Renko Overlay Indicator displays Renko bricks directly on the main price chart as a semi-transparent overlay.
Unlike traditional Renko charts that require a separate offline window, this indicator allows traders to view standard candlestick price action and Renko structure simultaneously on the same chart. The overlay helps identify trend direction, price noise, and consolidation phases without losing time-based market context. Key Feature
FREE

*** ATENCAO: CONHECA A VERSAO PRO PROFISSIONAL *** Gostou deste Relogio e Contador de Candles gratuito? Leve o seu trading para o proximo nivel! Conheca o Smart Candle Engine PRO, a versao premium que alem do tempo, monitora o VOLUME FINANCEIRO INSTITUCIONAL em tempo real. O indicador calcula a media e muda de cor (alerta laranja) no exato milissegundo em que os grandes bancos e robos institucionais entram agredindo o mercado. Ideal para operar rompimentos de VWAP e suportes importantes! CLI
FREE

Radar OB Hunter PRO is a clean and professional Order Block indicator for MetaTrader 5, developed by G-Radar Group.
The indicator was created for traders who want to identify potential buy and sell zones directly on the chart without using automatic execution. It highlights bullish and bearish Order Block areas with a clean visual layout, helping the trader read market structure with more clarity and less chart pollution.
Radar OB Hunter PRO does not open trades, does not manage orders and do
FREE

Input Menu: * Backtest Start * Market Session * Signal Trigger Type * Take Profit (Pips) * Stop Loss (Pips) * Spread test manual and Live Spread * Simulation Timeframe (M5/M15/H1) * Show Dashboard * Notification Alert * Push Notification * Telegram Notfication
Dashborad Menu: * Show Backtest Start * Show Trigger Active * Show Live Spread or Manual Spread Test * Total Trade / Closed Trade * Success Rate * Hit Take Profit * Hit Stop Loss * Gross P/L * Float Profit * Float Loss * Net Profit (Clos
FREE

TurnPoint Indicator – Market Reversal & Trend Signal Tool The TurnPoint Indicator is designed to help traders identify potential turning points and key levels in the market. By analyzing price action, it highlights areas where reversals or continuations are likely to occur, allowing traders to anticipate trend changes more effectively. This tool incorporates advanced logic to filter signals, reducing noise and false alerts. Users can choose between breakout and pullback modes, depending on their
FREE

Requires manual adjustment of the broker's time offset relative to New York by input offset parameter. Doesn't take into account summer-winter time shifts - adjust it yourself after the actual clock change using the same input parameter.
Shows BiasMachine.net key levels:
DO(Day Open) = 18:00 NY local time
NYM(New York Midnight) = 00:00 NY local time
Algo Days(!) Highs and Lows
(!) Algo-Day is the interval from NYM to the next NYM
Shows only the levels themselves, not the probabilities of ach
FREE
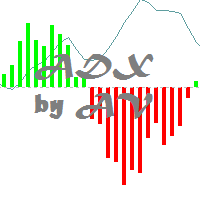
This is an unusual representation of the Average Directional Movement Index. The indicator has been developed at the request of a trader and for the purposes of learning the development of indicators in MQL5. The line shows the same as the standard Average Directional Movement Index (ADX); The upward histogram shows the difference between +DI and -DI, when +DI is above -DI; The downward histogram shows the difference between +DI and -DI, when +DI is below -DI.
FREE

Full Bearish Engulfing Merah Merah
Spot the Move Before the Crowd Does Most engulfing indicators only look at the candle body. Full Bearish Engulfing goes further — it only fires when the entire candle, wicks included, swallows the prior bearish candle by a margin you control. That means fewer false signals, and only the engulfs with real conviction behind them. What It Does Scans every closed candle for a bearish-into-bearish full engulf : the current candle's high clears the previous high, and
FREE

Smart Candle Analyzer (MQL5 Indicator) The Smart Candle Analyzer is a powerful trading tool designed to analyze and interpret candlestick behavior in real time. Unlike traditional indicators that only display price, this indicator decodes the underlying market momentum and buyer/seller pressure behind each candle. Key Features: Bullish & Bearish Strength Detection: Highlights strong buying or selling candles with clear arrows on the chart. Momentum Analysis: Measures the expansion or contraction
FREE

Français VolumeMS — Indicateur de Volume avec Zones de Surachat/Survente sur le Graphique (Gratuit) Basé sur Time Segmented Volume (TSV) , il affiche la domination des acheteurs ou des vendeurs ainsi que les niveaux de Fibonacci directement sur le graphique. Fonctions Histogramme de puissance du volume Current Bar Strength Niveaux de Fibonacci Zones de surachat et de survente Paramètres Calcul et lissage Fenêtre de normalisation Paramètres des zones Personnalisation complète Pour Traders u
FREE

Market Time Watch Un outil de suivi du temps léger, propre et essentiel pour chaque trader Market Time Watch est un affichage professionnel du temps sur graphique, conçu pour les traders qui ont besoin de voir l’heure locale, l’heure du serveur et le compte à rebours de la bougie en cours. Tout cela directement sur le graphique, sans interface lourde ou encombrée. Que vous fassiez du scalping, du day trading, du trading sur les news, ou que vous ayez simplement besoin d’une référence temporelle
FREE

Live Account Panel MT5 Live Account Panel MT5 is a clean chart-based information panel for MetaTrader 5. It shows the most important account values directly on the chart, so you do not need to check the Terminal window all the time. Main features: Live Balance Live Equity Floating Profit/Loss Used Margin Free Margin Margin Level Number of open positions Number of pending orders Current chart symbol Optional symbol-only filter Fully customizable display Adjustable panel position Adjustable font,
FREE
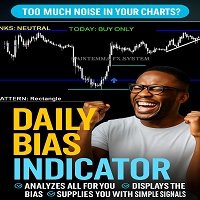
INTRODUCING the Powerful Daily Bias Indicator
The Daily Bias Indicator
Stop Guessing. Start Trading with Confidence.
Tired of staring at your charts and not knowing if today is a buy day or a sell day? The Daily Bias Indicator does the heavy lifting for you.
It scans the market using 7 powerful tools (EMA trend, RSI, MACD, ADX, Volume, Pivot Points & Price Action). It tells you in plain language:
“TODAY: BUY ONLY”
“TODAY: SELL ONLY”
Or “NO CLEAR BIAS” (so you don’t waste money
FREE
Indicateur Awesome Oscillator (AO) avec support multi-timeframe, signaux visuels personnalisables et système d'alertes configurable.
Les services de programmation freelance, les mises à jour et autres produits TrueTL sont disponibles sur mon profil MQL5 .
Les retours et avis sont très appréciés !
Qu'est-ce que l'AO ? L'Awesome Oscillator (AO), développé par Bill Williams, est un indicateur de momentum qui mesure l'élan du marché en calculant la différence entre une Moyenne Mobile Simple (SMA)
FREE

The trend can change while your attention is focused elsewhere. And sometimes, by the time you notice that the market has changed direction, the move is already several candles ahead. Cartwright TrendTrace Classic makes the current direction and confirmed trend changes easy to recognize — clearly, visually and without filling your chart with unnecessary tools. The indicator transforms a standard moving average into a simple directional guide. The line turns blue when it is rising and red when it
FREE

Candle Timer MT5 (FREE) Never miss a candle close again. Candle Timer MT5 is a lightweight and accurate countdown indicator that displays the remaining time until the current candle closes. It is designed for traders who need precise timing for entries, exits, and candle-based trading strategies. Whether you are a scalper, day trader, or swing trader, this indicator helps you stay synchronized with the market without distracting you from your analysis. Features Accurate real-time candle countdow
FREE
Moving Average Color
Moving Average (MA) is a trend indicator, which is a curved line that is calculated based on price changes. Accordingly, the moving average is the trader’s assistant, which confirms the trend. On the chart it looks like a bending line that repeats the price movement, but more smoothly. Moving Average Color it is a standard moving average indicator with a color change when the trend direction changes. The ability to set additional levels has also been added. It is a handy too
FREE
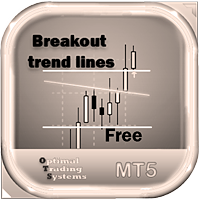
Free indicator to quickly detect trendline breakouts and high or low of a price range. It displays lines based on the highs and lows of prices, and also finds and displays inclined trend lines. As soon as the price goes beyond the line and the candlestick closes, the indicator signals this with an arrow (you can also enable an alert). This indicator is easy to use and also free. The number of candles for defining trend lines as well as the high and low of the trading range is configurable. It w
FREE
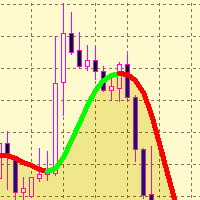
The SMTrendLine indicator is based on the principles of graphical construction of Bollinger bands.
Graphically, the Bollinger is two lines that limit the price dynamics from above and from below, respectively. These are a kind of support and resistance lines, which most of the time are located at levels far from the price.
As we know, the Bollinger bands are similar to the envelopes of moving averages. The difference between them is that the envelope boundaries are located above and below the
FREE

# INVAI Risk Planner
INVAI Risk Planner is a visual position sizing indicator for MetaTrader 5. It helps traders plan an Entry, Stop Loss and Take Profit before placing a trade manually.
The indicator does not open, close or modify trades. It does not place pending orders. All trading decisions and order execution remain under the user's control.
## Main features
- Three visual levels: Entry, Stop Loss and Take Profit. - Direct vertical dragging without permanent selection points. - Positio
FREE

Totally linked to the result of a movement and the duration he had. Its height records how many ticks the asset walked during a given movement, its width shows us the duration that movement had. Its configuration must be in line with the Weis Wave Indicator configuration to observe the movement force and can indicate a possible accumulation or distribution of the movement;
FREE

This is the Stargogs Volatility Arrow V1 Yeahhh!!! This Arrow is based on trend, support and demand and based on EMA's. You can change the parameters or settings like you want to. Message Me for the System which works best with this Indicator for free (include: Template, and other indicators). This indicator works with all Currency Pairs, All Volatility indices, All Indices, Boom & Crash Indices, Gold and NASDAQ. Works on All Timeframes Add the following to your chart with Stargogs Volatility A
FREE
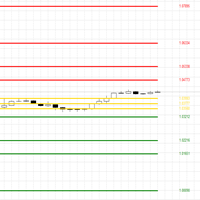
The CPR (Central Pivot Range) Indicator is a powerful technical analysis tool designed to identify key support and resistance levels on your MetaTrader 5 charts. It calculates the Central Pivot (CP) as the average of the previous day's high, low, and close prices, providing a central reference point. Calculates and plots 11 pivot levels (CP, BC, TC, S1-S4, R1-R4) Adjustable lookback period (default: 5 days) Option to show or hide price labels with customizable size and offset Fully customizable
FREE
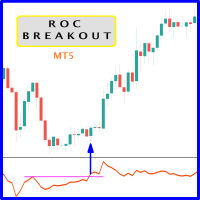
When prices breakout resistance levels are combined with Rate of Change oscillator "ROC" oscillator breaks out its historical resistance levels then probability emerges to record farther prices. It's strongly encouraged to confirm price breakout with oscillator breakout since they have comparable effects to price breaking support and resistance levels; surely, short trades will have the same perception. Concept is based on find swing levels which based on number of bars by each side to confirm
FREE

Ritz Smart Trend Adaptive Finder – Auto-Detect Dynamic Trend Channels A powerful trend detection indicator that adaptively analyzes price structure using dynamic ATR and statistical filters to discover the most significant trend channels on any timeframe and symbol. This tool automatically finds the most relevant period and slope for price movement and draws upper/lower channel zones, midline (mean), and trend support/resistance. Suitable for trend-following, breakout, and mean-reversion strateg
FREE

ICT market structure from any timeframe - HH, HL, LH, LL, every BOS and CHoCH, with alerts - and a table that measures how often price really followed each break on your chart. ICT Market Structure Honest Stats labels every swing high and low, draws each break of structure (BOS) and change of character (CHoCH), shows the levels the next break needs, alerts you the moment a new break forms, and measures on your chart's own history how often price went on in the break's direction compared with ran
FREE

QM Candle Timing Meter is a free MetaTrader 5 indicator designed to answer one simple question: How late am I in the current candle? A trading signal may still be technically valid while the timing of the entry has already changed significantly. For example, entering during the first minutes of an H1 candle is very different from entering when 90% of that candle has already elapsed. QM Candle Timing Meter continuously measures the temporal position of the current candle and displays this informa
FREE
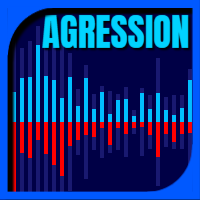
This is a buyer and seller aggression indicator that analyzes the shape of each candle and project this data in a histogram form. There are 4 histograms in one. On the front we have two: Upper - Buyer force. Lower - Seller force. At the background we also have two histogram, both with same color. They measure the combined strenght of buyers and sellers. This histograms can be turned off in Input Parameters. It is also possible to have the real or tick volume to help on this force measurement. IN
FREE
The Supertrend etradro indicator is volatility based and is more of a trend following indicator in function. The ATR indicator, which is integrated into the calculation of the super trend, also calculates course gaps (gaps) and does not overlook them. This allows more accurate values to be calculated. When measuring volatility, the mean value of the current price serves as the basis. Since the Supertrend indicator features sliding stop and reversal lines, it is quite similar in function to the P
FREE
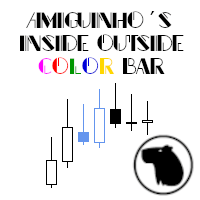
A simple price action indicator to highlight inside and outside bars (candles) with colors. It is possible to choose what type of bar can be highlighted among: inside, ouside or both. It is can be possible to choose a first specific color for the shadow and the border of bars (candles), a second specific color for high/bull bar (candle) and a third specific color for down/bear bar (candle)
FREE

Grid Scalp Master Indicator Grid Scalp Master Indicator is a powerful, visual-centric market momentum and grid simulation system engineered specifically for MetaTrader 5. It translates complex mathematical breakout and asymmetrical grid logic into a clean, actionable visual framework directly on your chart layout. Designed for traders who want the precision of a grid execution model without giving up manual control, this indicator tracks high-probability breakout zones, maps dynamic grid layers,
FREE
The Vix_Fix indicator, or "Vix Fix," is a tool designed to identify potential market bottoms. It operates on the principle of measuring extreme fear or pessimism among the crowd, which are moments when the market often has a high probability of reversing to the upside. Main Purpose: To help traders find high-probability BUY (Long) entry points by identifying when the market is "oversold." How it Works In simple terms, the Vix Fix measures the distance between the current bar's Low and the Highes
FREE
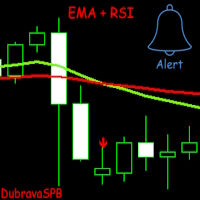
Introducing EMA + RSI – A Trading Indicator Combining Exponential Moving Average (EMA) and Relative Strength Index (RSI) Analysis. The indicator signals trade entries with arrows on the chart when two EMAs cross and the RSI meets the specified conditions.
It is initially optimized for the GBPUSD currency pair on the 1H timeframe, but users can customize it to fit their strategy. Key Features: Flexible settings: Users can adjust EMA length, choose the price for calculation, and configure RSI para
FREE

El **Heiken Ashi Smoothed** es una versión suavizada del indicador técnico Heiken Ashi, que se utiliza en el análisis de gráficos de velas para identificar tendencias del mercado y pronosticar movimientos de precios. Este indicador se basa en el promedio de datos de precios para formar un gráfico de velas que ayuda a los traders a filtrar el ruido del mercado.
**¿Para qué sirve?** Este indicador se utiliza para identificar cuándo los traders deben permanecer en una operación y cuándo está por
FREE

READ THE MARKET BEFORE YOU TRADE IT.
A setup means nothing if the market conditions behind it are wrong.
NOSTROMO MARKET ANALYZER is a professional Market Conditions Indicator for MT5 built to tell you what kind of market you are dealing with before capital is committed.
One premium HUD. Immediate context. No noise.
KNOW THE ENVIRONMENT.
MARKET PULSE QUIET · ACTIVE · EXPANDING · EXTREME
OPERATIVE STATE MARKET CLOSED · STANDBY · SELECTIVE · OPERATIVE · HIGH INTENSITY · CAUTION
GLOBAL SES
FREE
Multi-Period EMA is a convenient indicator that displays multiple Exponential Moving Averages (EMAs) on a single chart. It is designed to help traders easily identify market trends and key crossover points without the need to add multiple individual EMA indicators. Key Features: Multiple EMAs in one: Simplifies chart analysis by combining several EMA lines into one indicator. Fully customizable: Easily change the period (default 20, 50, 100, 200), color, and thickness of each EMA line. Clean in
FREE

CRYSTAL TIMELESS - Trade With Pure Price, Not Time The clock lies. Price tells the truth. Every standard chart forces you to watch the market through time - one candle per minute, per hour, per day - whether the market is moving or not. The result is endless noise, fake moves and dead candles that hide what really matters. Crystal Timeless removes time completely and rebuilds your chart from pure price movement, so the real trend and real turning points finally become obvious at a glance. Powere
FREE

OmniSignal Navigator – Scalping intelligent aux niveaux clés Tradez comme un professionnel avec cet indicateur quotidien/hebdomadaire High-Low-Close, conçu pour le scalping et le trading de cassures de précision.
Pourquoi ça marche ? Idéal pour le scalping : cible les zones clés (PDH/PDL/PDC et PWH/PWL/PWC) sur les unités de temps M2, M3, M5 et M15. (Unités de temps courtes = plus de signaux, unités de temps longues = moins de signaux) Aucune analyse graphique nécessaire : attendez s
FREE

This indicator extracts a trend from a price series and forecasts its further development. Algorithm is based on modern technique of Singular Spectral Analysis ( SSA ). SSA is used for extracting the main components (trend, seasonal and wave fluctuations), smoothing and eliminating noise. It does not require the series to be stationary, as well as the information on presence of periodic components and their periods. It can be applied both for trend and for another indicators.
Features of the me
FREE

Donchian Dawn Breakout System My other products: https://www.mql5.com/zh/users/bitksk/seller 1. What Problem Does It Solve Manually identifying trend breakouts often relies on subjective judgment and lacks consistency. This indicator programmatically and visually implements the Donchian channel breakout logic, solving three core problems: Signal Standardization : Automatically generates arrow signals when the price breaks through the upper or lower band of the dynamic channel, eliminating subjec
FREE

XC Regime Oscillator - Volatility-Adjusted MA Distance XC Regime Oscillator is a free technical tool designed to help traders understand market regime, trend pressure and statistically stretched price conditions. The indicator measures how far price is trading from a user-defined Moving Average and expresses this distance in volatility-adjusted terms using ATR.
This approach transforms raw price deviation into a normalized oscillator that adapts automatically to changing market conditions. By co
FREE

Cet indicateur est basé sur le célèbre indicateur fractal mais avec beaucoup de personnalisation et de flexibilité,
il s'agit d'un outil puissant pour identifier les inversions de tendance et maximiser votre potentiel de profit.
Avec ses fonctionnalités avancées et son interface conviviale, c'est le choix ultime pour les traders de tous niveaux. Version MT4 : Ultimate Fractals MT4 Caractéristiques :
Nombre de bougies fractales personnalisables. Lignes d'inversion. Paramètres personnalisabl
FREE

# The Knowledge and Theory of the Normal Distribution Chart Indicator in the Gold MT5 Trading Platform In the complex environment of the financial market, especially in the gold MT5 trading platform, traders need to rely on various tools to analyze market dynamics, among which the normal distribution chart indicator plays a crucial role. The normal distribution, also known as the Gaussian distribution, is a fundamental and key probability distribution in statistics. In the gold market, the norma
FREE
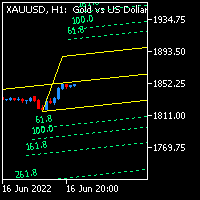
Andrew Pitch fork is one of the most interesting string trend & Channel & Fibo technical analysis , it's like ALL in ONE tool would be very enough for you.
Using 2 Andrew pitch Forks with 2 different time frames on same chart is really very hard working and might be impossible , but with this indicator is possible now , moreover , using this method as Candle Volume based analysis give strong trust for your trade.
I assume if you are having 1 daily pith fork lets say with 22 Candle value , and
FREE

ATLAS GOLD MATRIX EMA 50 / EMA 200 Gold Signal Indicator for XAUUSD
Atlas Gold Matrix is a professional Gold trading indicator designed for XAUUSD traders who prefer structured, trend-aligned signals with clear risk planning.
The indicator combines a Gold-focused price calculation engine with EMA 50 and EMA 200 trend confirmation, ATR-based Entry / Stop Loss / Take Profit zones, candle confirmation, session filtering, signal cooldown,
FREE

Aurum Xau Vector is a professional trading indicator designed specifically for Gold / XAUUSD.
The indicator combines price geometry, Fibonacci-style target alignment, ATR-based risk zones, MACD confirmation, candle confirmation, session filtering, and alert notifications in one clean tool.
It is built for traders who want fewer but more selective Gold signals. Instead of printing many random arrows, Aurum Xau Vector focuses on quality filtering and can be configured to allow only one signal p
FREE
RSI Bollinger DualStrike Signals propose une approche claire et structurée pour identifier des zones potentiellement favorables aux retournements de tendance. En combinant le RSI avec les Bandes de Bollinger , l’indicateur met en évidence les moments où le prix montre des signes de pression ou d’essoufflement. Les signaux BUY/SELL aident les traders à prendre des décisions plus organisées et disciplinées. C’est un outil utile pour le scalping, le day trading ou le swing, sans prétendre prédire l
FREE
Savez-vous pourquoi MetaTrader Market est le meilleur endroit pour vendre des stratégies de trading et des indicateurs techniques ? Pas besoin de publicité ou de protection logicielle, pas de problèmes de paiement. Tout est fourni dans le MetaTrader Market.

Vous manquez des opportunités de trading :
- Applications de trading gratuites
- Plus de 8 000 signaux à copier
- Actualités économiques pour explorer les marchés financiers
Inscription
Se connecter
Vous acceptez la politique du site Web et les conditions d'utilisation
Si vous n'avez pas de compte, veuillez vous inscrire