Rejoignez notre page de fans

Forecasting of Price Ranges - indicateur pour MetaTrader 4

- Vues:
- 26836
- Note:
- Publié:
- Mise à jour:
-
 Vous manquez des opportunités de trading :
- Applications de trading gratuites
- Plus de 8 000 signaux à copier
- Actualités économiques pour explorer les marchés financiers
Inscription Se connecterVous acceptez la politique du site Web et les conditions d'utilisation
Si vous n'avez pas de compte, veuillez vous inscrire -
 Besoin d'un robot ou d'un indicateur basé sur ce code ? Commandez-le sur Freelance
Aller sur Freelance
Besoin d'un robot ou d'un indicateur basé sur ce code ? Commandez-le sur Freelance
Aller sur Freelance
The idea was taken from the book "The New Science of Technical Analysis" by Thomas R. Demark. Demark advises to use own calculation for forecasting the daily range of the prices. As far as the data of one daily bar is used for the calculation, this caculation can be applied to the bars on the other periods of the chart just as well.
The indicator draws a colored region before each bar, it is the presumed price range of the next bar.
Picture:
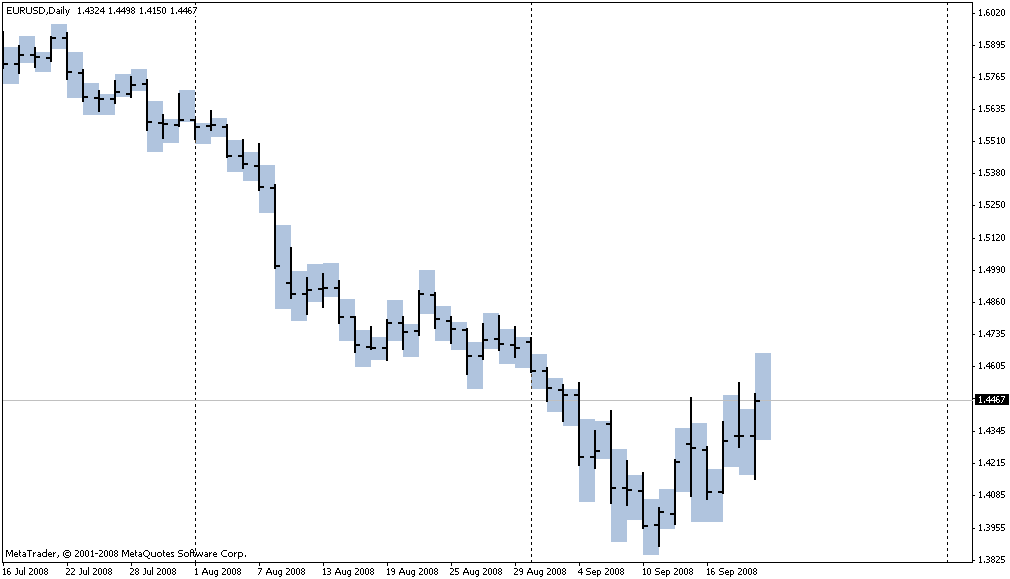
Forecasting of Price Ranges
Thanks to WWer for the help.
Traduit du russe par MetaQuotes Ltd.
Code original : https://www.mql5.com/ru/code/8437
Variations on the Topic of WPR
A small set of indicators.
 e_RP_250
It was developed on my order for working with the RPoint indicator. I reached this variant by changing the parameters of the indicator and the EA. Change the ReversePoint value to 250 when placing the indicator.
 ZG_All Quotings 1
Uploading of history of all symbols from the Market Watch window by all TF. The recording to a file of names and trading condtions by all symbols from the Market Watch window.
Trend Indicators
A small set of the trend indicators.