Rejoignez notre page de fans

Wildhog - indicateur pour MetaTrader 5
- Vues:
- 7049
- Note:
- Publié:
- Mise à jour:
-
 Vous manquez des opportunités de trading :
- Applications de trading gratuites
- Plus de 8 000 signaux à copier
- Actualités économiques pour explorer les marchés financiers
Inscription Se connecterVous acceptez la politique du site Web et les conditions d'utilisation
Si vous n'avez pas de compte, veuillez vous inscrire -
 Besoin d'un robot ou d'un indicateur basé sur ce code ? Commandez-le sur Freelance
Aller sur Freelance
Besoin d'un robot ou d'un indicateur basé sur ce code ? Commandez-le sur Freelance
Aller sur Freelance
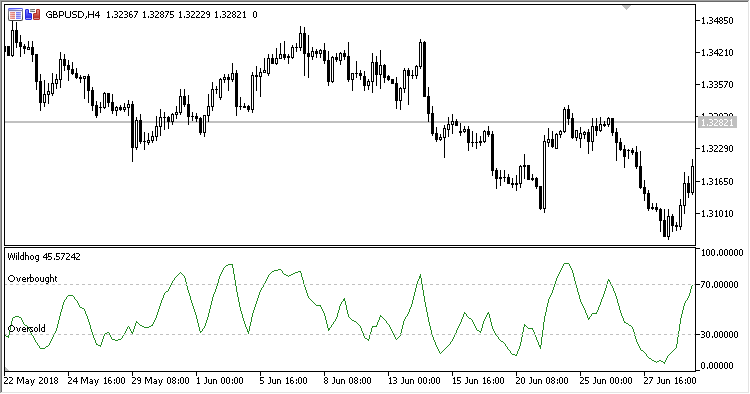
Wildhog oscillator displays asset's overbought/oversold states, as well as searches for divergences. It works on any timeframe.
The system is based on the last High, Low and Close eight bars.
The indicator has three input parameters:
- Period - calculation period
- Overbought - overbought level
- Oversold - oversold level
Calculation:
Wildhog = 100 * (Close-Min) / (3 * (Max-Min)) + PrevWildhog
where:
Max, Min are the highest and lowest prices within the Period interval
Traduit du russe par MetaQuotes Ltd.
Code original : https://www.mql5.com/ru/code/21393
DEMA_Range_Channel_HTF
DEMA_Range_Channel indicator with the timeframe selection option available in input parameters
DirectCandlesCounter_Candle
DirectCandlesCounter indicator in the form of candles.
 MostasHaR15 Pivot
The EA uses the following indicators: iADX (Average Directional Movement Index, ADX), two iMAs (Moving Average,MA) - one indicator at CLOSE prices and another one at OPEN prices, iOsMA (Moving Average of Oscillator, OsMA).
AMA Histogram
The histogram displays the difference of a Close price and iAMA (Adaptive Moving Average, AMA) indicator value.