 MetaTrader 5
 Experts
 Indicateurs
 Scripts
 Bibliothèque
 Stockage
Voir comment télécharger gratuitement des robots de trading
Retrouvez-nous sur Telegram !
Rejoignez notre page de fans
Rejoignez notre page de fans
Vous avez aimé le script ? Essayez-le dans le terminal MetaTrader 5

AMA Histogram - indicateur pour MetaTrader 5
Vladimir Karputov

Create a personal work for me: https://www.mql5.com/en/job/new?prefered=barabashkakvn
- Vues:
- 4838
- Note:
- Publié:
- Mise à jour:
-
 Vous manquez des opportunités de trading :
- Applications de trading gratuites
- Plus de 8 000 signaux à copier
- Actualités économiques pour explorer les marchés financiers
Inscription Se connecterVous acceptez la politique du site Web et les conditions d'utilisation
Si vous n'avez pas de compte, veuillez vous inscrire -
 Besoin d'un robot ou d'un indicateur basé sur ce code ? Commandez-le sur Freelance
Aller sur Freelance
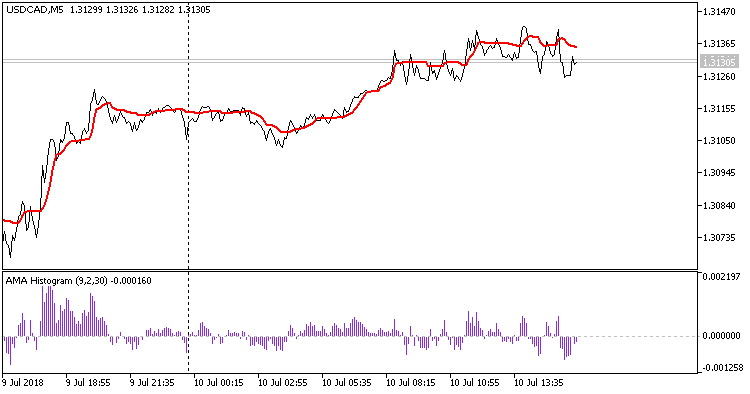
AMA Histogram is an indicator that shows the difference of a Close price and iAMA (Adaptive Moving Average, AMA) indicator value as a histogram.
Traduit du russe par MetaQuotes Ltd.
Code original : https://www.mql5.com/ru/code/21400
 MostasHaR15 Pivot
The EA uses the following indicators: iADX (Average Directional Movement Index, ADX), two iMAs (Moving Average,MA) - one indicator at CLOSE prices and another one at OPEN prices, iOsMA (Moving Average of Oscillator, OsMA).
Wildhog
Wildhog indicator