Rejoignez notre page de fans
- Publié par:
- Vladimir Karputov
- Vues:
- 13070
- Note:
- Publié:
-
Besoin d'un robot ou d'un indicateur basé sur ce code ? Commandez-le sur Freelance Aller sur Freelance
Idea by: raposter.
MQL5 code by: Vladimir Karputov.
The program uses the overbought (OB) and oversold (OS) zones, for which it generates trading signals for selling or buying. OB and OS are determined on M15, H1, and H4. To demonstrate the program, the EURUSD M15 chart was chosen.
The program has to triggers to show the comparison of alternative methods to determine OB/OS.
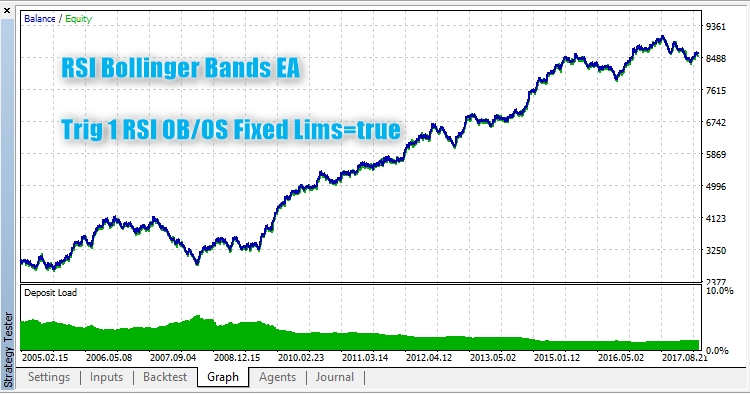
- The first trigger is the conventional method that uses fixed figures to determine the RSI overbought/oversold zones. The OB and OS zones begin with the typical RSI levels with the values of 70 and 30.
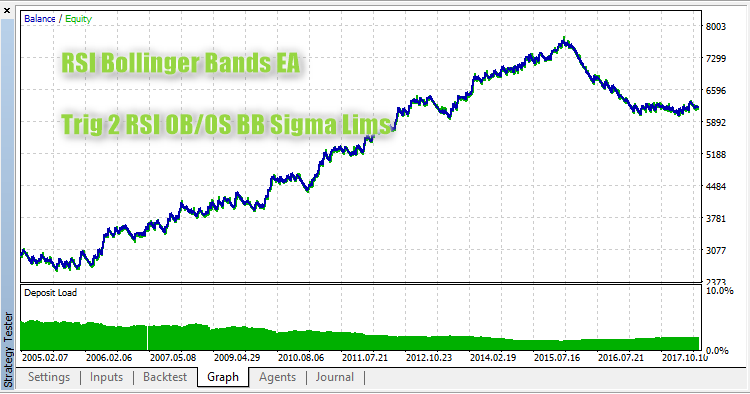
- Trigger No. 2 places Bollinger Bands around the average RSI for a certain period of time. The OB and OS zones are determined as the levels of standard deviation from the average RSI. For example, the overbought signal will be a state where the RSI value is higher than RSI_Upper, where RSI_Upper = RSI_Sigma*StdDev + RSI_Avg. In this expression, RSI_Sigma is the dispersion level, and standard deviation (StdDev) is calculated from the RSI distribution on the last bars.
As you can see from the two Strategy Tester reports attached below, trigger No. 2 (by the Bollinger Bands method) shows good results for the testing period of over 11 years and is superior to trigger No. 1. Moreover, trigger No.2 works more evenly and shows much lower dispersion of the results than trigger No. 1 on M15 over 11 years.


Traduit du russe par MetaQuotes Ltd.
Code original : https://www.mql5.com/ru/code/20705
 EMAVFS_channel
A channel using a non-smooth and steady approximation error, in which the exponential moving average with a variable smoothing factor is used as the midline.
 EMAVFS_HTF
Indicator EMAVFS with the timeframe selection option available in input parameters.
