Rejoignez notre page de fans
- Vues:
- 4944
- Note:
- Publié:
- Mise à jour:
-
Besoin d'un robot ou d'un indicateur basé sur ce code ? Commandez-le sur Freelance Aller sur Freelance
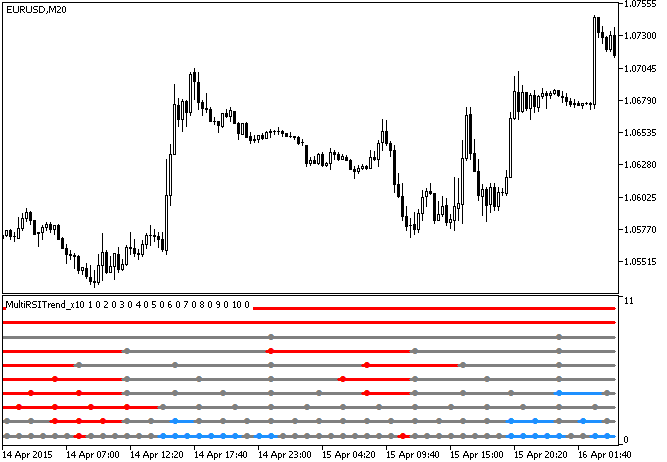
The MultiRSITrend_x10 indicator shows information on current trends using the RSI oscillator position from ten different timeframes.
Each of the ten indicator lines corresponds to a separate indicator. If the oscillator is positioned lower than the oversold level, the lines are painted in red, if it's higher than the overbought level, the lines are painted in medium blue. Otherwise, the lines are gray. Colored dots on the lines appear when the bar of the corresponding timeframe changes.

Fig.1. The MultiRSITrend_x10 indicator
Traduit du russe par MetaQuotes Ltd.
Code original : https://www.mql5.com/ru/code/12986
 RSITrend_x10
The RSITrend_x10 indicator shows the RSI oscillator position from ten different timeframes.
 CandleTrend_x10
The CandleTrend_x10 indicator shows price movement from ten different timeframes.
 MultiRVITrend_x10
The MultiRVITrend_x10 indicator shows information on current trends using the RVI oscillator position from ten different timeframes.
 RVITrend_x10
The RVITrend_x10 indicator shows the RVI oscillator position from ten different timeframes.