TradingDirection
- Indicadores
- Versión: 1.0
- Activaciones: 5
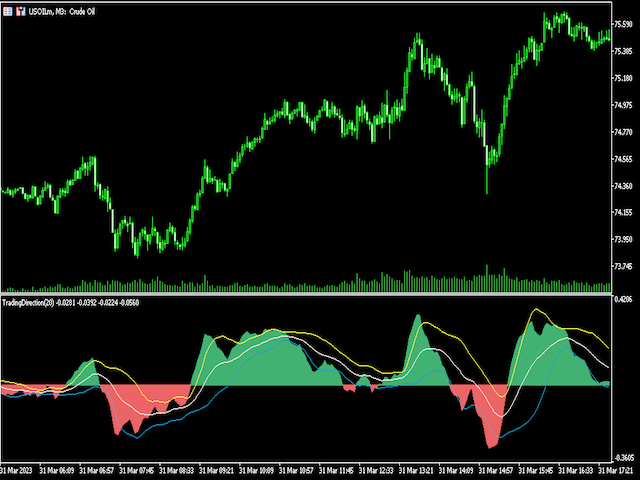
TradingDirection es un indicador de tendencia para el comercio a medio y largo plazo. En el gráfico se puede ver claramente cuando la tendencia alcista, cuando la tendencia bajista, y al mismo tiempo en la tendencia, se puede ver la posición obvia y la posición de reducción de posición. Al mismo tiempo, y BestPointOfInitiation (https://www.mql5.com/zh/market/product/96671) indicador puede formar una combinación perfecta, los dos indicadores entre sí para comprender mejor el momento de la factura.
=================== Lista de parámetros =====================
fastPeriod: 9
slowPeriod: 30
PassivationCoefficient: 5
================= Referencia al uso de ===================
Este indicador puede aplicarse a cualquier instrumento de negociación y puede utilizarse en cualquier periodo.