Magnetic Levels
- Indicadores
- Versión: 1.0
- Activaciones: 5

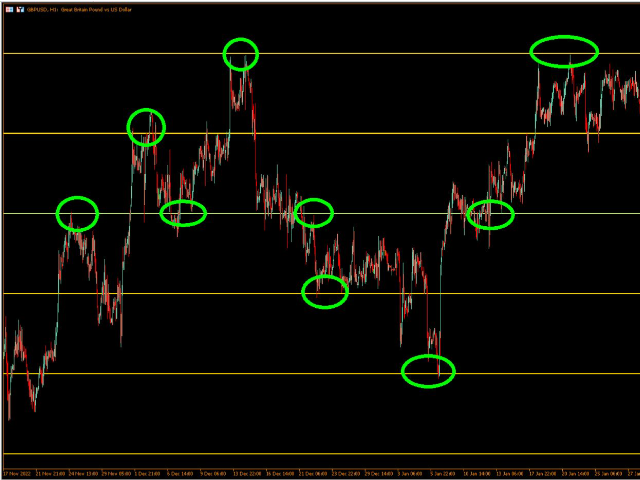
Los niveles magnéticos para MT5 son una gran adición a su estrategia de trading si utiliza niveles de soporte y resistencia, zonas de oferta y demanda.
El precio muy a menudo da buenos puntos de entrada a la posición exactamente en los niveles redondos y cerca de ellos.
El indicador es totalmente personalizable y fácil de usar:
-Elija el número de niveles que se mostrarán
-Elija la distancia entre los niveles
-Elija el color de los niveles.
Se puede añadir a su sistema de comercio para una mayor confluencia. Funciona muy bien cuando se combina con mi otro indicador MultiTF MA.
Personalmente, lo uso para las entradas de francotirador.