Standard PVSR
- Indicadores
- Versión: 1.0

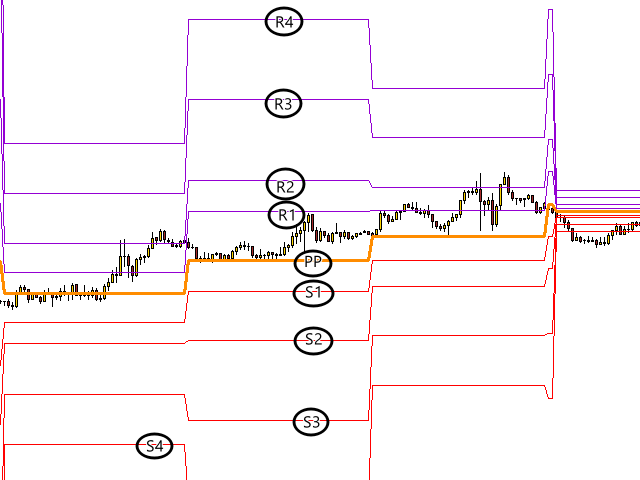
El PVSR estándar se basa en puntos pivote.
Pasos para configurar el indicador:
Instale el Indicador Personalizado;
Configure todas las Líneas de Color, Ancho y Estilos;
Configure la visualización a Todos los Marcos de Tiempo; y
HECHO👍
Se puede utilizar para:
- Todos los Pares: Forex, Criptodivisas, Metales, Acciones, Índices, etc.
- Todos los plazos
- Todos los Brokers
- Todo tipo de estilos de trading como Scalping, Swing, Intradía, Corto Plazo, Largo Plazo, etc.
- Gráficos Múltiples
-->> Para cualquier tipo de soporte, orientación, configuración, optimización de EA, configuración de entrada, etc., puede ponerse en contacto conmigo.
Grupo de Soporte--->> https://www.mql5.com/en/messages/030709F84DE2D801