NewTrendAlert
- Indicadores
- Versión: 1.2
- Actualizado: 20 mayo 2022
- Activaciones: 5

Las Alertas de Nuevas Tendencias encuentran nuevas tendencias en la barra de cambio muy rápidamente. Si la tendencia tiene suficiente potencia y un ángulo ascendente/descendente de calidad, el indicador envía múltiples alarmas para avisarle: por correo electrónico, notificación móvil, ventana de alerta y sonido de alerta. Todas estas alarmas diferentes son opcionales, y usted puede elegir cuáles desea utilizar.
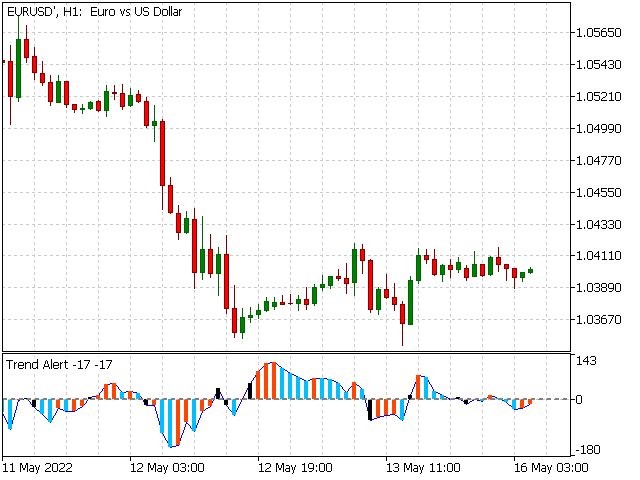
El indicador calcula la derivada del gráfico de precios para revelar la pendiente de la curva de precios y sus cambios de signo. Las barras rojas indican un signo positivo o tendencia alcista y las barras cian indican una tendencia bajista. Hay otra alarma visual, una barra negra. Después de un cambio de dirección de la tendencia, la barra del indicador cambia a un color negro. Así que está equipado con 5 señales diferentes y nunca se perderá una tendencia.
Los valores positivos de la curva del indicador muestran la existencia de tendencias alcistas y viceversa. El cambio de barra roja a barra cian simplemente revela lo cerca que está el final de la tendencia. Así, una tendencia alcista no habrá terminado tras la aparición de la barra Cian.
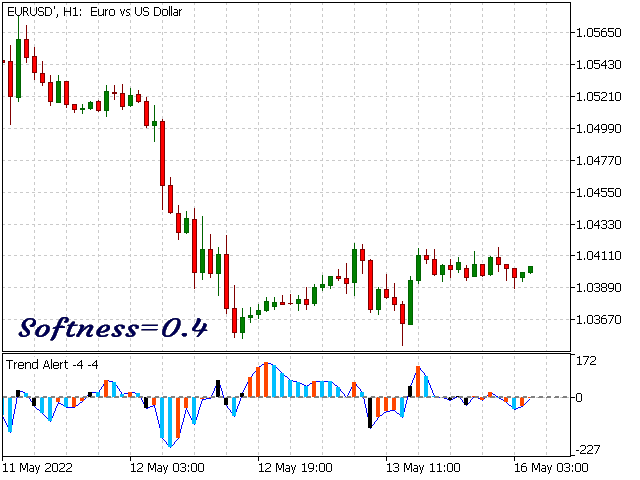
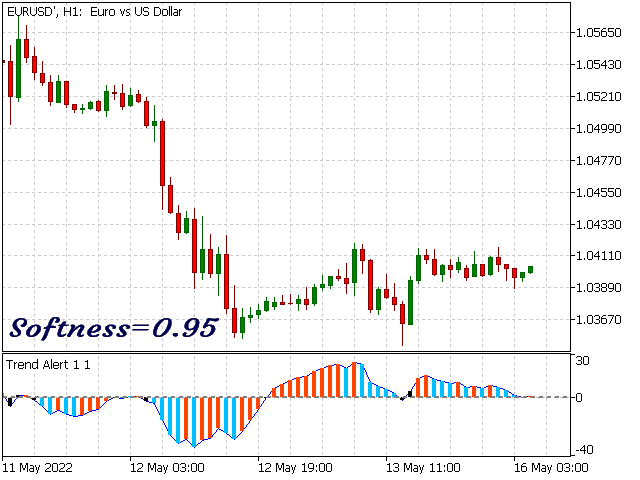
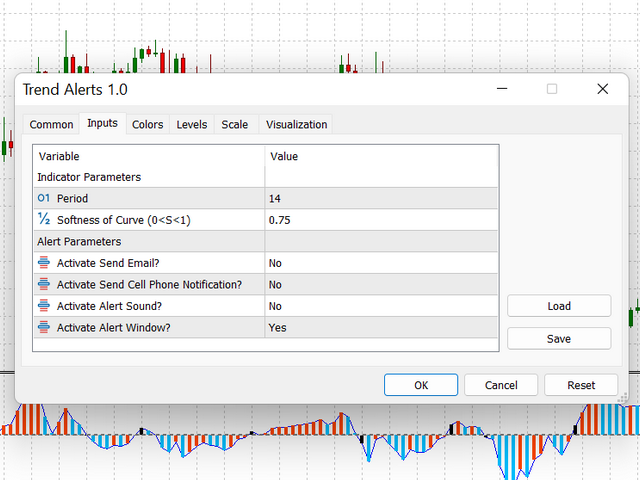
Hay dos grupos de parámetros de entrada: La Configuración del Indicador consiste en el periodo, SOFTNESS y Precisión, y la Configuración de la Alerta. Con un valor más alto de SOFTNESS, el indicador ignora pequeños cambios en el precio y tendencias bajas. Por lo tanto, el indicador permanece más tiempo en su estado de tendencia alcista o bajista. A menor SOFTNESS, mayor sensibilidad pero menor precisión. El parámetro Precisión se utiliza para controlar cuándo enviar la alarma. El valor mínimo es de 40 pips. Si la variación de la curva de precios es menor que el valor de Precisión, entonces no se enviará ninguna alarma.
Las Alertas de Nueva Tendencia tienen menos sensibilidad en plazos cortos como M1 y M5. Por lo tanto, puede seleccionar plazos más largos como H1 y superiores.
Parámetros de entrada:
| Configuración del indicador | |
| Período | Periodo |
| SUAVIDAD | Suavidad de la curva (0<S<1) |
| Precisión | Precisión de las alertas (pip) |
| Ajuste de alertas | |
| sendEmail | ¿Activar Enviar Email? |
| sendNotification | ¿Activar el envío de notificaciones por teléfono móvil? |
| AlertaSonido | ¿Activar sonido de alerta? |
| Ventana de alerta | ¿Activar ventana de alerta? |