KT Forex Sessions MT5
- Indicadores
-
KEENBASE SOFTWARE SOLUTIONS
 Keenbase Trading desarrolla indicadores profesionales y Asesores Expertos (Expert Advisors) para MetaTrader 4 y MetaTrader 5, diseñados para ayudar a los traders a tomar decisiones de trading más informadas.
 - Versión: 1.0
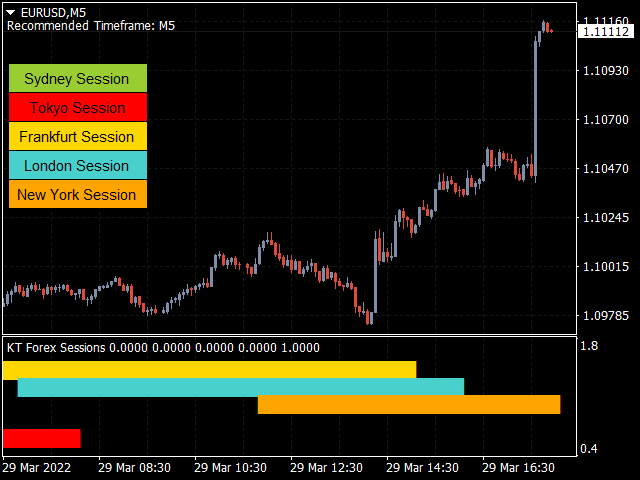
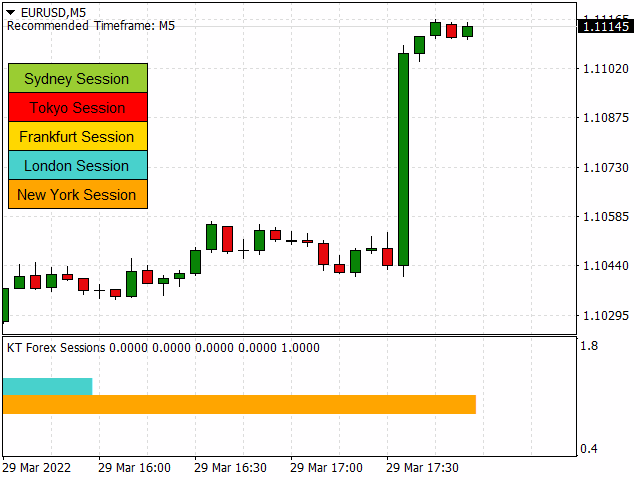
KT Forex Session muestra las diferentes sesiones del mercado Forex mediante ilustraciones significativas y alertas en tiempo real. Forex es uno de los mercados financieros más grandes del mundo, que está abierto 24 horas al día, 5 días a la semana. Sin embargo, eso no significa que funcione de manera uniforme durante todo el día.
Características
- Indicador ligeramente codificado para mostrar las sesiones del mercado de divisas sin utilizar recursos masivos.
- Proporciona todo tipo de alertas Metatrader cuando comienza una nueva sesión.
- Totalmente personalizable.
Horarios de las Sesiones Forex
Los operadores de Forex intradía necesitan conocer los horarios de apertura y cierre de las principales bolsas de divisas. Hay cinco bolsas principales con los siguientes horarios:
| Sesión | Inicio | Fin |
|---|---|---|
| Sidney | 21 GMT | 5 GMT |
| Tokio | 23 GMT | 7 GMT |
| Fráncfort | 6 GMT | 14 GMT |
| Londres | 7 GMT | 15 GMT |
| Nueva York | 12 GMT | 20 GMT |
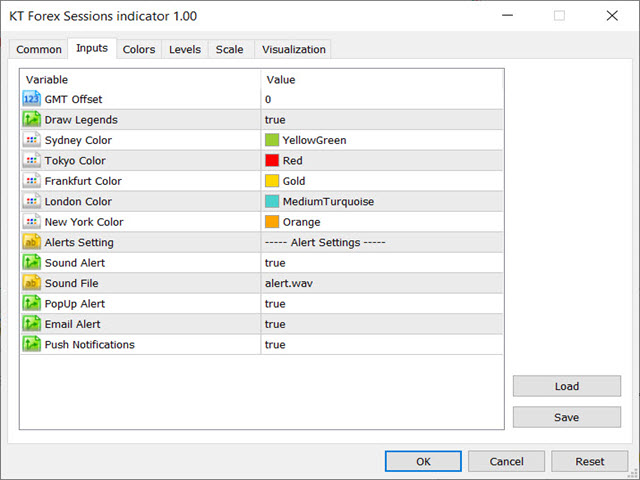
Entradas
- Desplazamiento GMT: Basado en su Broker, inserte aquí su offset GMT.
- Dibujar Leyendas: Dibuja las leyendas de la sesión en la esquina superior izquierda del gráfico.
- Elija el color de la sesión.
- Configuración de alertas.