Channel Creator
- Indicadores
- Versión: 1.0
- Activaciones: 5
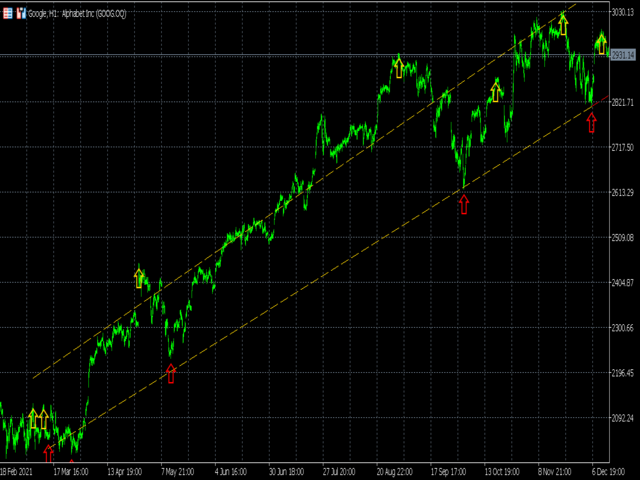
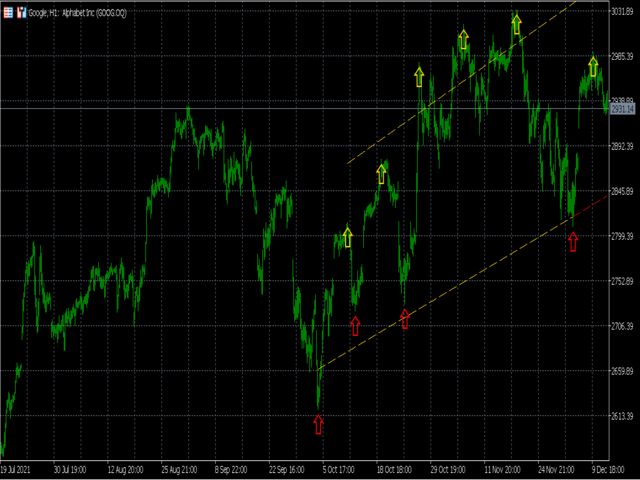
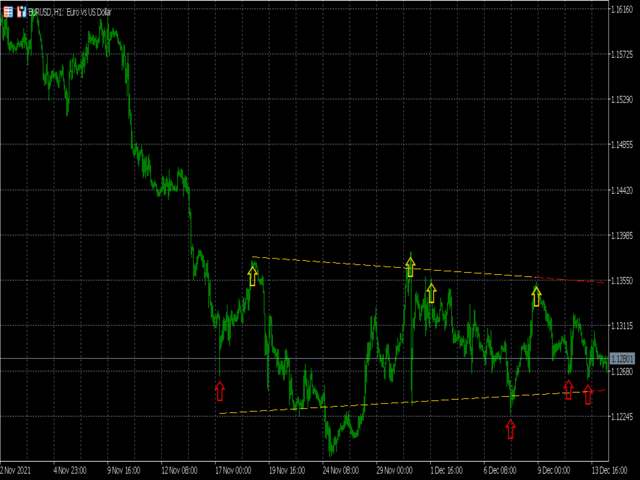
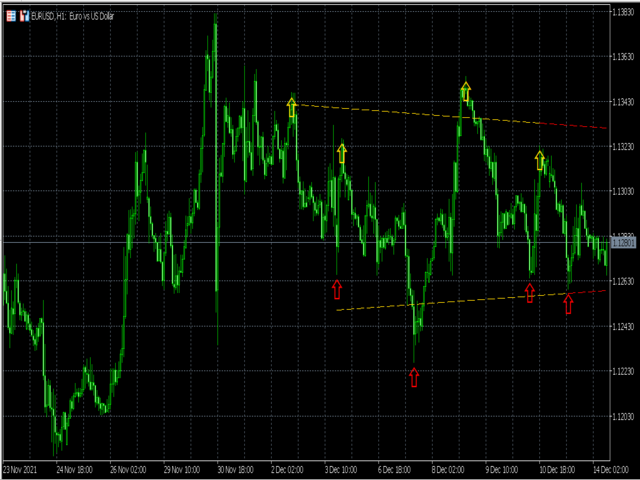
El indicador de canal automático crea una línea superior y una línea inferior que encierran un canal dentro del cual ha estado cotizando el símbolo.
El canal se crea encontrando puntos altos para la línea superior y puntos bajos para la línea inferior, estos puntos se muestran con flechas. A continuación, se traza una línea de mejor ajuste a través de estos puntos y se extiende hasta el final del gráfico.
Este indicador es útil tanto para operar dentro del canal como para las rupturas.
Entradas:
MAPeriod - El periodo de la media móvil sobre el que se encuentran los puntos superior e inferior.
showArrows - Se puede establecer en false si no desea ver los puntos superior e inferior.