ResistanceSupport
- Indicadores
- Versión: 1.0
- Activaciones: 5

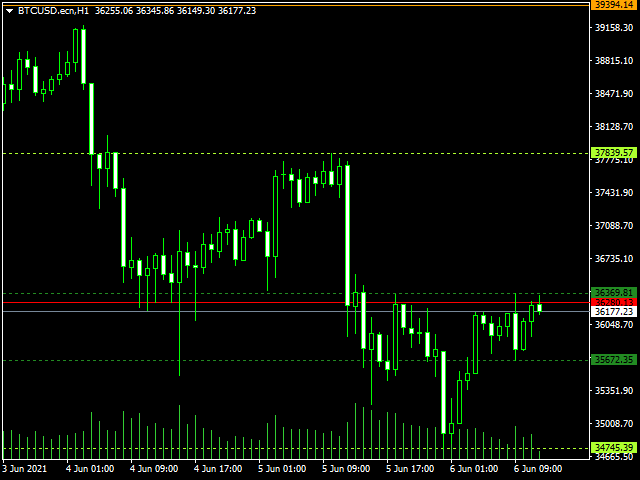
Un nivel de resistencia es lo contrario de un nivel de soporte. Es donde el precio tiende a encontrar resistencia a medida que sube. Una vez más, esto significa que es más probable que el precio "rebote" en este nivel en lugar de atravesarlo. Sin embargo, una vez que el precio ha superado este nivel, por una cantidad superior a cierto ruido, es probable que siga subiendo hasta encontrar otro nivel de resistencia.
Un nivel de soporte es un nivel en el que el precio tiende a encontrar apoyo a medida que cae. Esto significa que es más probable que el precio "rebote" en este nivel en lugar de atravesarlo. Sin embargo, una vez que el precio ha superado este nivel, por una cantidad superior a cierto ruido, es probable que siga cayendo hasta encontrarse con otro nivel de soporte.
(*) Puede encontrar más información aquí https://en.wikipedia.org/wiki/Support_and_resistance
Este indicador muestra los niveles de resistencia y soporte H1, H4, D1, W1 y MN1 al instante.