MACD Stochastic Setups For MT5
- Indicadores
-
Eadvisors Software Inc.
 Estratégias de negociação automatizadas para o mercado financeiro.
Robôs de Negociação e indicadores.
[Automated trading strategies]
Contate o Desenvolvedor: eadvisorsbr@yahoo.com - Versión: 206.19
- Activaciones: 5
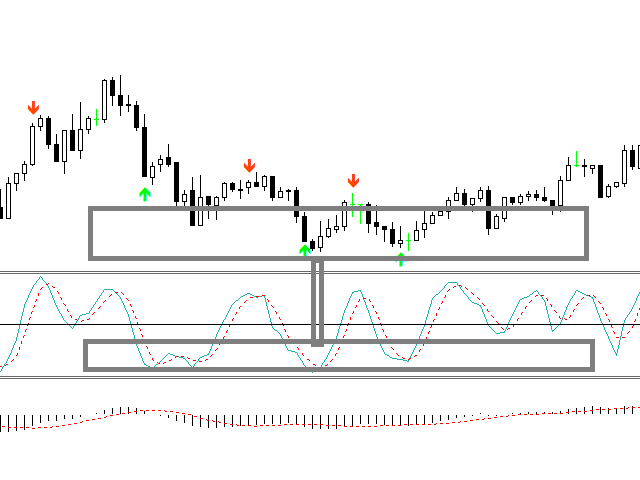
The Moving Average Convergence Divergence Indicator (MACD) is both a trend–seeking and momentum indicator which uses several exponential moving averages set to closing prices to generate trading signals.
Esta Versión trajo a usted la confluencia Estocástica filtrando las señales, este conjunto de entradas increíbles en los índices y el comercio de futuros de acciones.
Características del producto
- Alerta sonora
- Notificación Push (Las alertas se pueden enviar a su teléfono móvil)
- Señales en el gráfico
- Cuadro de alerta
- Alerta sobre cruce de histograma cero o cruce de signo de línea.
- DelayCrossFilter
- Estocástico K, D, conjunto de retardos
- Nivel de sobrecompra, sobreventa del filtro estocástico
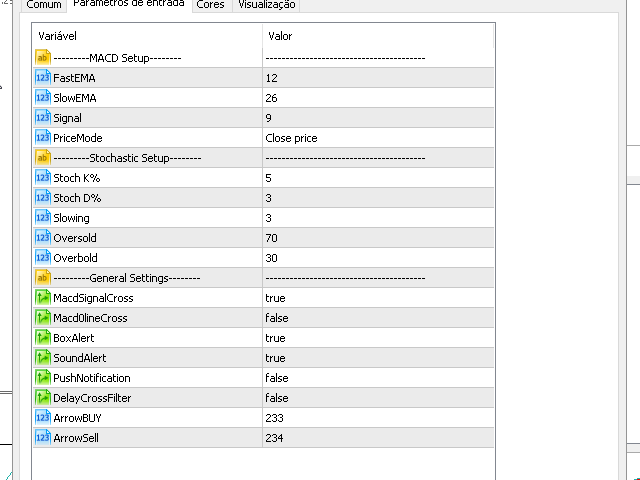
Parámetros del indicador
- Rápido/Lento/Señal - Establece la configuración del MACD EMA.
- PriceMode - Establece el tipo de precio con el que se va a trabajar.
- MACDSignalCross - Habilita alertas en eventos de cruce de MACD x Señal.
- MACDLine0Cross - Habilita alertas en eventos MACD x 0line cross.
- BoxAlert - Habilita una simple caja de alerta en los eventos.
- Alerta deSonido - Habilita la alerta de sonido en modo de cruce o nivel.
- Push Notification - Esta opción permite a su MetaTrader 5 enviar alertas a su smartphone (IOS o Android).
- DelayCrossFilter - Establece las alertas en la siguiente barra para evitar cruces prematuros. (Filtro de alertas falsas).
- ArrowCodBuy - Establece el código de la flecha MQL para comprar.
- ArrowCodSell - Establecer el código de la flecha MQL para vender signo.