MACD Stochastic Setups For MT5
- 지표
-
Eadvisors Software Inc.
 Estratégias de negociação automatizadas para o mercado financeiro.
Robôs de Negociação e indicadores.
[Automated trading strategies]
Contate o Desenvolvedor: eadvisorsbr@yahoo.com - 버전: 206.19
- 활성화: 5
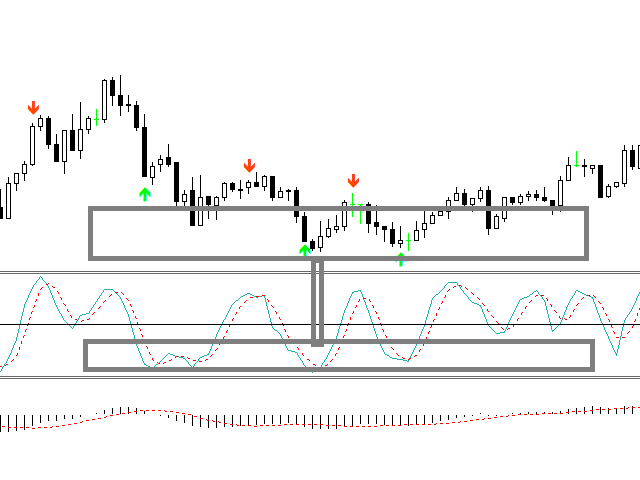
The Moving Average Convergence Divergence Indicator (MACD) is both a trend–seeking and momentum indicator which uses several exponential moving averages set to closing prices to generate trading signals.
This Version brought to you the Stochastic confluence filtering the signals, this set ups amazing entries on índices and stock futures trading.
Product Features
- Sound alert
- Push Notification (Alerts can be sent to your mobile phone)
- Signs on chart
- Alert box
- Alert on zero histogram cross or line sign cross.
- DelayCrossFilter
- Stochastic K, D, Slowing set
- Level of overbrought, oversold of stochastic filter
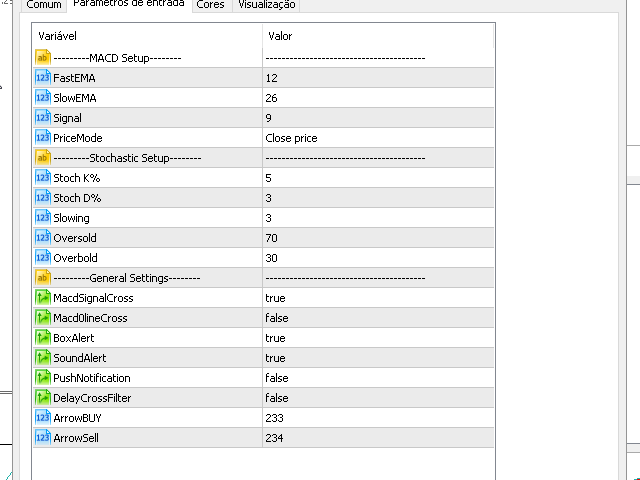
Indicator Parameters
- Fast/Slow/Signal - Sets up the MACD EMA configuration.
- PriceMode - Sets up the Price type to work with.
- MACDSignalCross - Enable alerts on MACD x Signal cross events.
- MACDLine0Cross - Enable alerts on MACD x 0line cross events.
- BoxAlert - Enable simple alert box on events.
- Sound Alert - Enable sound alert on cross or level mode.
- Push Notification - This option enables your MetaTrader 5 to send alerts to your smartphone (IOS or Android).
- DelayCrossFilter - Set the alerts on the next bar to avoid premature crosses. (False alerts filter).
- ArrowCodBuy - Set the MQL Arrow code to buy sign.
- ArrowCodSell - Set the MQL Arrow code to sell sign.