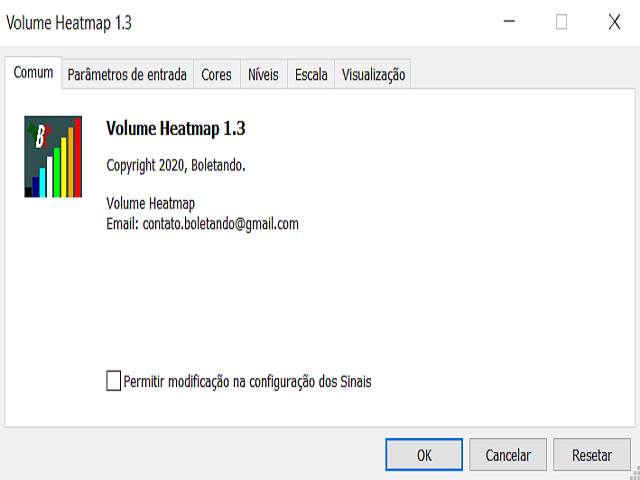
Volume HeatMap DEMO
- Indicadores
- Versión: 1.3
- Actualizado: 16 noviembre 2020

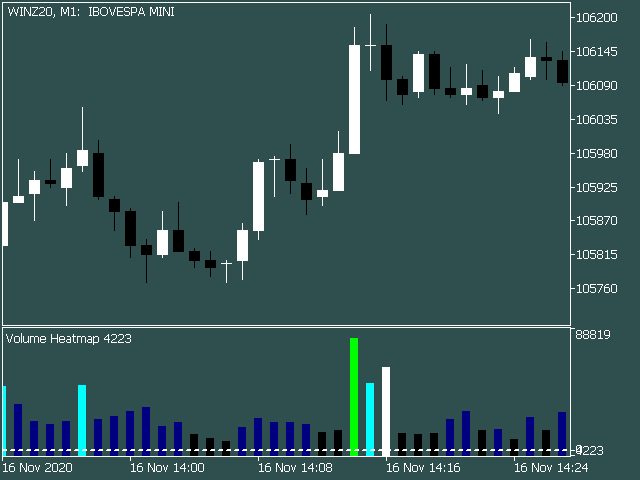
El indicador Volume Heatmap muestra visualmente la INTENSIDAD del volumen teniendo en cuenta el concepto de desviación estándar.
Objetivo del indicador:
Los volúmenes elevados son habituales cuando existe un fuerte consenso de que los precios van a subir. Un aumento del volumen suele producirse al inicio de una nueva tendencia alcista en el precio de un activo. Algunos analistas técnicos no confían en las confirmaciones de tendencias sin un aumento significativo del volumen. Los volúmenes bajos suelen producirse cuando un activo se dirige hacia una tendencia bajista. Se caracterizan por expectativas indefinidas que se producen en periodos de consolidación. De este modo, puede tener una idea exacta de la intensidad del volumen actual en comparación con los volúmenes pasados y actuar de acuerdo con su estrategia, teniendo aún más confianza en sus operaciones.
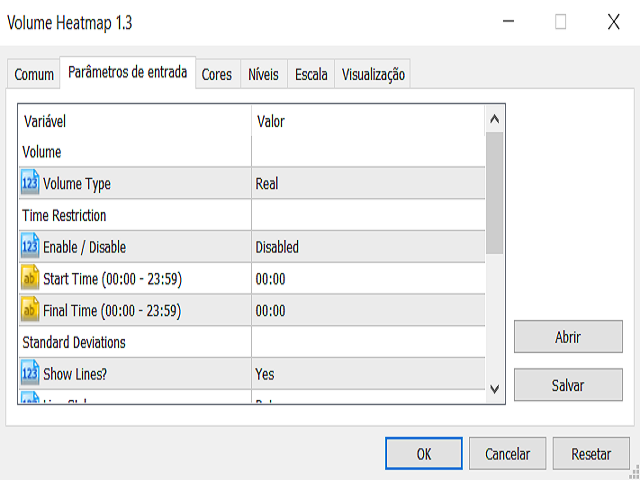
Ajustes:
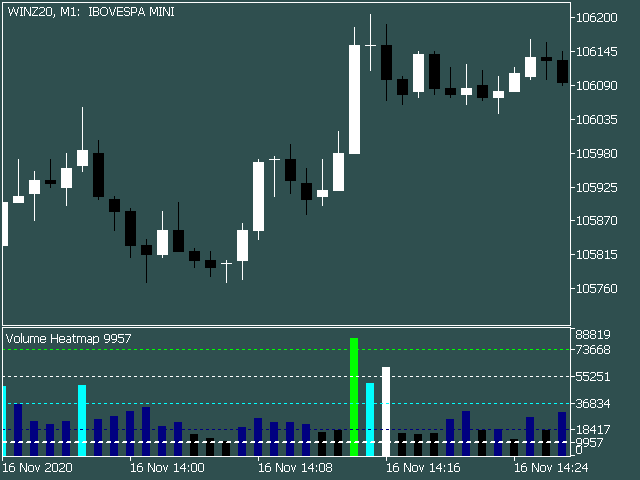
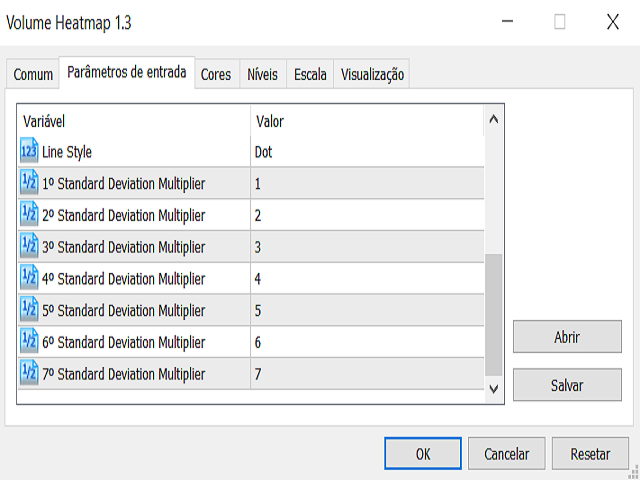
- Posibilidad de ajustar los rangos de intensidad utilizando los multiplicadores de desviación estándar.
- Posibilidad de limitar el funcionamiento del indicador sólo para cálculos en un rango de tiempo, esta característica permite excluir volúmenes del inicio y final de la subasta a través de la restricción de tiempo.
- Posibilidad de elegir entre cálculo con volumen de ticks o volumen real.
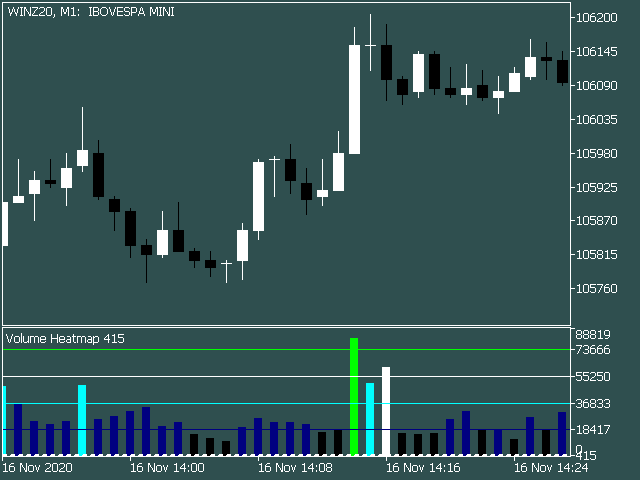
- Posibilidad de mostrar u ocultar las líneas de desviaciones estándar.
- Posibilidad de elegir el tipo de línea de las desviaciones estándar (punteada, discontinua, continua, etc.).
Integración EA:
- Buffer 0 - Volumen
- Buffer 1 - Color del volumen (0-7)
- Buffer 2 - Desviación estándar
ALERTAS:
- Si la restricción de tiempo está ON, el buffer de volumen tendrá un VALOR CERO para las barras de volumen que hayan sido restringidas por el tiempo.
- El indicador NO funciona para brokers que no proporcionan información de volumen.
- El indicador es compatible con EA (Robot).
- USE la versión DEMO para comprobar la funcionalidad del indicador ANTES de comprar la versión PRO.
- Esta versión DEMO tiene TODAS sus características TOTALMENTE habilitadas. La única limitación es que el indicador sólo funciona en la CUENTA DEMO.
¿Has probado el Volume Heatmap DEMO?
Obtenga la versión PRO: https://www.mql5.com/en/market/product/57801