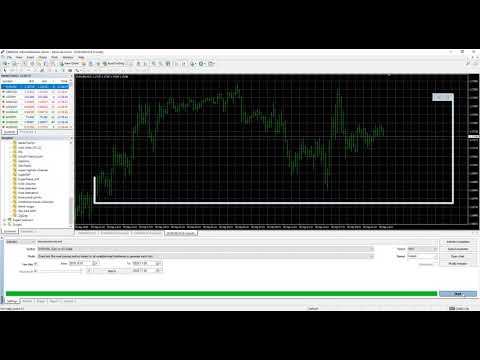
Time Range Pivot Points
- Indicadores
-
Nikolay Georgiev
 I am Nikolay Georgiev 33 years old now in 2020. I used to work for prop trading company as Head of IT and Algotrading. I am experienced coder with MQL4 MQL5, and I love solving problems. I am trading for myself and deliver EA's, indicators and strategies to interested 3rd parties.
 - Versión: 1.0
- Activaciones: 10
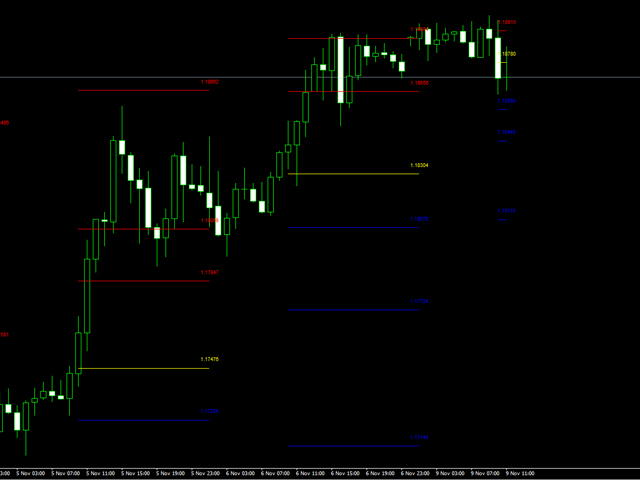
Time Range Pivot Points es un indicador que trazará Pivot Point + niveles de Soporte y Resistencia en el gráfico, pero calculará la fórmula basándose en un rango de tiempo específico, que puede ser definido en los ajustes.
Si desea operar con éxito en las sesiones europea y estadounidense, será inteligente comprobar todos los niveles generados por el rango de tiempo de la sesión asiática. Este indicador le permitirá hacerlo.
Todo está diseñado para obtener una ventaja de los posibles niveles de soporte y resistencia para la próxima sesión basada en el rango de la sesión anterior.
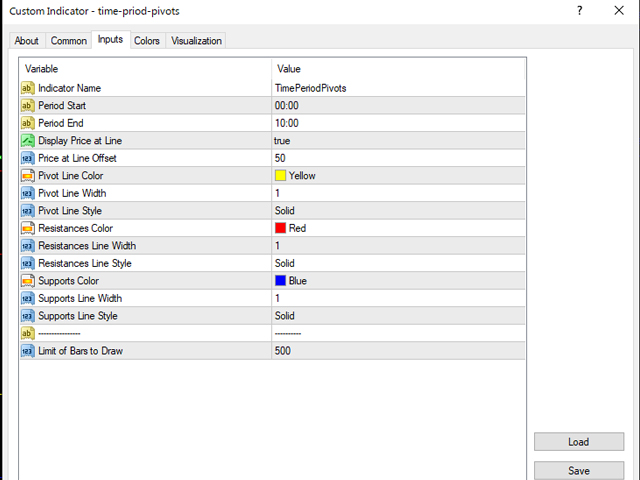
El indicador tiene un montón de ajustes para permitir que cada uno elija el estilo y el color de las líneas.
El indicador de la fórmula es la habitual:
Pivote = (H + L + C) / 3
R 1 = P + (P - L) = 2×P - L
S 1 = P - (H - P) = 2×P - H
R 2 = P + (H - L)
S 2 = P - (H - L)
R 3 = H + 2×(P - L) = R 1 + (H - L)
S 3 = L - 2×(H - P) = S 1 - (H - L)