Blue Raptor Oscillator
- Indicadores
- Versión: 1.0
- Activaciones: 5

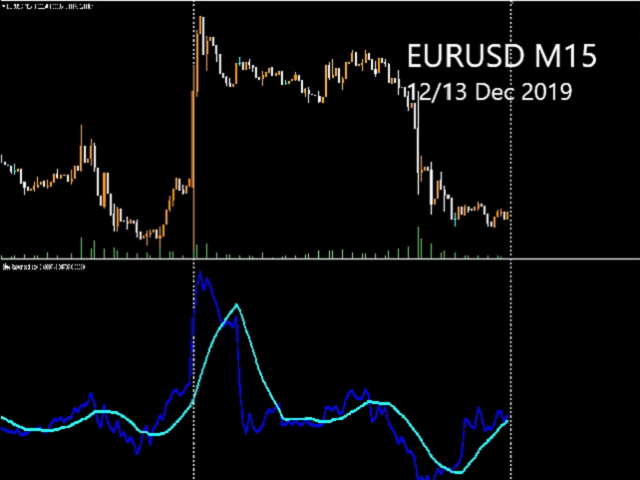
Un oscilador de cruce de dos líneas para la entrada y salida del mercado. Utilícelo en M15 y superiores para una mayor precisión. Coloque el indicador en un segundo gráfico con el mismo par de divisas y amplíelo para obtener una mejor visión.
El indicador da una buena idea de la volatilidad, el volumen y la tendencia. Funciona en cualquier par de divisas, pero extremadamente bien en pares de divisas con buena volatilidad PIP diaria como GBPJPY, GBPNZD y pares de divisas exóticas.
Utilícelo durante las principales sesiones del mercado, como Londres y Londres-Nueva York, para obtener los mejores resultados. Asegúrese de que hay suficiente volumen/liquidez en el mercado antes de realizar una operación.
Realice operaciones largas cuando las líneas se crucen y la línea azul oscuro esté por encima de la línea aqua, y operaciones cortas cuando la línea aqua esté por encima de la línea azul oscuro.
La configuración por defecto es de 14 periodos, pero puede cambiarla según sus preferencias.
Método_Suavizado
0 - SMA
1 - EMA
2 - SMMA
3 - LWMA