HistogramChart
- Indicadores
- Versión: 213.0

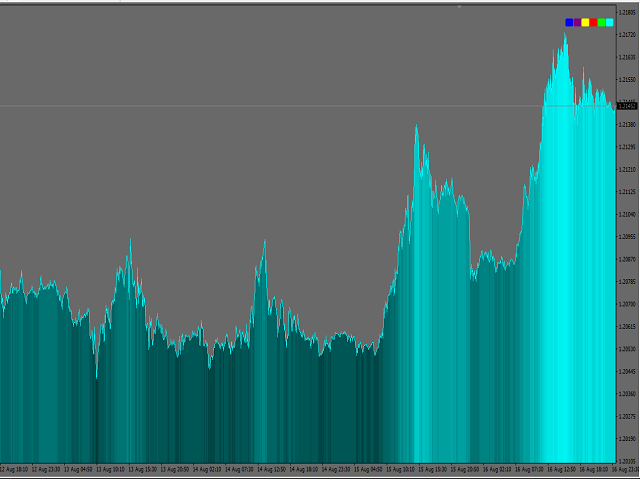
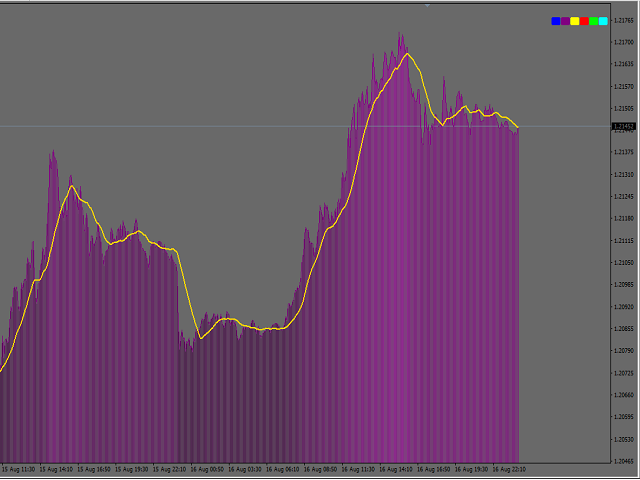
El indicador añade una superposición al gráfico para crear un histograma.
No hay parámetros que configurar.
En el gráfico puede elegir el color en la esquina superior derecha haciendo clic en el ladrillo correspondiente.
El histograma se sombrea en función del valor del precio.
Recuerde establecer un gráfico de líneas (mostrado en la captura de pantalla).
........................... Te invito a comprar.