HistogramChart

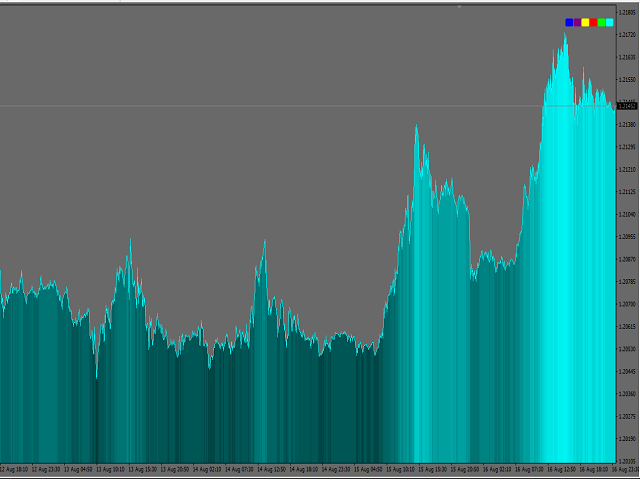
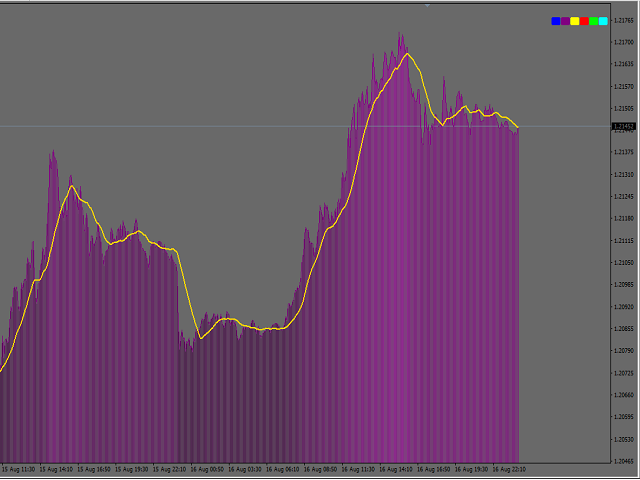
The indicator adds an overlay to the graph to create a histogram.
There are no parameters to set.
On the chart you can choose the color in the upper right corner by clicking on the appropriate brick.
The histogram is shaded depending on the price value.
Remember to set a line chart (shown in the screenshot).

........................... I invite you to purchase.

추천 제품
Pin Bars
Yury Emeliyanov
5 (4)
주요 목적:"핀 바"는 금융 시장 차트에서 핀 바를 자동으로 감지하도록 설계되었습니다. 핀 바는 특징적인 몸체와 긴 꼬리를 가진 촛불로,추세 반전 또는 교정을 신호 할 수 있습니다. 작동 원리:표시기는 차트의 각 촛불을 분석하여 촛불의 몸,꼬리 및 코의 크기를 결정합니다. 미리 정의 된 매개 변수에 해당하는 핀 막대가 감지되면 표시기는 핀 막대의 방향(강세 또는 약세)에 따라 위 또는 아래 화살표로 차트에 표시합니다. 매개 변수: 꼬리의 길이와 핀 바의 몸체 크기 사이의 최소 비율을 정의합니다. "코"와 핀 바의 꼬리 사이의 최대 허용 비율을 설정합니다. 화살표 크기-표시된 핀 막대와 차트에서 핀 막대를 가리키는 화살표 사이의 거리를 정의합니다. 신청:"핀 바"표시기는 잠재적 인 추세 반전 지점을 식별하고 시장 또는 가까운 위치에 진입하기 위해 신호를 생성하는 데 사용할 수 있습니다. 올바르게 사용하고 다른 기술 지표 및 분석 방법과 결합하면이 지표는 거래 결과를 향상시킬 수
FREE
Cart Indicator
Akira Egashira
This is a regression tree indicator for MT4/MT5. This indicator classificate nodes on the time period so that the deviation becomes smaller, and displays regression line and channel for each node. It's free! Attached CartDemo.ex4 and CartDemo.ex5 is a Demo version and has the following limitations: Can't use HighSpeed method (default method is RandomForest) Maximum number of bars is 260 (increase from 200) There is no expiration date and can be started many times, but it stops after an hour.
FREE
FlatBreakout
Aleksei Vorontsov
FlatBreakout (Free Version) Flat Range Detector and Breakout Panel for MT4 — GBPUSD Only FlatBreakout is the free version of the professional FlatBreakoutPro indicator, specially designed for flat (range) detection and breakout signals on the GBPUSD pair only. Perfect for traders who want to experience the unique fractal logic of FlatBreakout and test breakout signals on a live market without limitations. Who Is This Product For? For traders who prefer to trade breakout of flat ranges (breakout,
FREE
Trendline indicator
David Muriithi
2 (1)
Are you tired of drawing trendlines every time you're analyzing charts? Or perhaps you would like more consistency in your technical analysis. Then this is for you. This indicator will draw trend lines automatically when dropped on a chart. How it works Works similar to standard deviation channel found on mt4 and mt5. It has 2 parameters: 1. Starting Bar 2. Number of bars for calculation The   starting bar   is the bar which drawing of the trend lines will begin, while the   number of bars for c
FREE
Free automatic fibonacci
Tonny Obare
4.67 (49)
Free automatic Fibonacci is an indicator that automatically plots a Fibonacci retracement based on the number of bars you select on the BarsToScan setting in the indicator. The Fibonacci is automatically updated in real time as new highest and lowest values appears amongst the selected bars. You can select which level values to be displayed in the indicator settings. You can also select the color of the levels thus enabling the trader to be able to attach the indicator several times with differe
FREE
Extremum Reverse Bar
Yurij Izyumov
2.8 (5)
This indicator has been created for finding the probable reversal points of the symbol price. A small candlestick reversal pattern is used it its operation in conjunction with a filter of extremums. The indicator is not redrawn! If the extremum filter is disabled, the indicator shows all points that have a pattern. If the extremum filter is enabled, the condition works – if the history Previous bars 1 candles back contains higher candles and they are farther than the Previous bars 2 candle, such
FREE
Highlights trading sessions on the chart The demo version only works on the AUDNZD chart!!! The full version of the product is available at: (*** to be added ***) Trading Session Indicator displays the starts and ends of four trading sessions: Pacific, Asian, European and American. the ability to customize the start/end of sessions; the ability to display only selected sessions; works on M1-H2 timeframes; The following parameters can be configured in the indicator: TIME_CORRECTION = Correct
FREE
Cumulative Delta MT4
Evgeny Shevtsov
4.86 (29)
The indicator analyzes the volume scale and splits it into two components - seller volumes and buyer volumes, and also calculates the delta and cumulative delta. The indicator does not flicker or redraw, its calculation and plotting are performed fairly quickly, while using the data from the smaller (relative to the current) periods. The indicator operation modes can be switched using the Mode input variable: Buy - display only the buyer volumes. Sell - display only the seller volumes. BuySell -
FREE
FFx Momentum
Eric Venturi-Bloxs
4 (1)
The purpose of this new version of the MT4 standard indicator provided in your platform is to display in a sub-window multiple timeframes of the same indicator. See the example shown in the picture below. But the display isn’t like a simple MTF indicator. This is the real display of the indicator on its timeframe. Here's the options available in the FFx indicator: Select the timeframes to be displayed (M1 to Monthly) Define the width (number of bars) for each timeframe box Alert pop up/sound/ema
FREE
Stat Monitor 4
Sergei Linskii
Stat Monitor is a good information indicator. Benefits of the indicator: The indicator provides useful information - the current spread, the cost of one lot of the symbol, trading leverage and the recommended lot size for trading. You can use the indicator on the MetaTrader 4 trading platform of any broker. The indicator provides useful information. Version of the Stat Monitor indicator for MetaTrader 5 I wish you all good luck in trading and stable profit!
FREE
Indicator to be placed in the same folder as Dash to activate the alert filter with Heiken Aish. After downloading the indicator, copy it to the same folder so Dash can read the indicator. It is not necessary to insert it into the chart, this is only for Dash to search for signals and inform the direction of buying and selling of the Indicator. Check if the indicator's path is correct within Dash.
FREE
Power Trend Free
Yurij Kozhevnikov
5 (2)
Power Trend Free - the indicator shows the trend strength in the selected period. Input Parameters The indicator has three input parameters: Period - a positive number greater than one, it shows the number of candlesticks used for calculations. If you enter one or zero, there will be no error, but the indicator will not be drawn. Applied Price - the standard "Apply to:" set meaning data used for the indicator calculation: Close - Close prices; Open - Open prices; High - High prices; Low - Low p
FREE
The indicator analyzes the change in the minimum and maximum prices of the previous bars fixing the entrance of the big players. If the change (delta) increases, a signal is displayed on the graph in the form of an arrow. At the same time, virtual trade on history is carried out. In the free version, virtual trade is performed without refills in case of a repeat of the signal. The results of virtual trading in the form of losses / losses, profitability, drawdown and transaction lines are display
FREE
SMA Indicator
Nitu Brijesh Yadav
Arrow Indicator (Buy/Sell Alerts) – Simple Yet Powerful Tool!             Product Version: 1.01           Indicator Type: Trend Reversal Signals           Timeframes Supported: All (Recommended: H1, H4, D1)           Key Features: Buy Signal: Green upward arrow () appears below the candle  Sell Signal : Red downward arrow () appears above the candle Accurate Trend Reversal Detection – Based on tried and tested SMA strategy. ️ Clean Chart View – Minimalist, non-i
FREE
New Bar Alarm Free
Tomoyuki Nakazima
This indicator alerts you when/before new 1 or 5 minute bar candle formed. In other words,this indicator alerts you every 1/5 minutes. This indicator is especially useful for traders who trade when new bars formed. *This indicator don't work propery in strategy tester.Use this in live trading to check functionality. There is more powerful Pro version .In Pro version,you can choose more timeframe and so on. Input Parameters Alert_Or_Sound =Sound ----- Choose alert or sound or both to notify y
FREE
High Low Open Close MT4
Alexandre Borela
4.81 (21)
이 프로젝트를 좋아한다면 5 스타 리뷰를 남겨주세요. 이 지표는 열리고, 높은, 낮은 및 마감 가격을 지정합니다. 기간과 그것은 특정한 시간대를 위해 조정될 수 있습니다. 이들은 많은 기관 및 전문가에 의해 보는 중요한 수준입니다 상인은 당신이 더 많은 것일 수있는 장소를 알고 도움이 될 수 있습니다 이름 * 사용 가능한 기간: 이전 날. 이전 주. 지난 달. 이전 분기. 이전 연도. 또는: 현재 날. 현재 주. 현재 달. 현재 분기. 현재 년.
FREE
FFx Fractals
Eric Venturi-Bloxs
4.5 (2)
The purpose of this new version of the MT4 standard indicator provided in your platform is to display in a sub-window multiple timeframes of the same indicator. See the example shown in the picture below. But the display isn’t like a simple MTF indicator. This is the real display of the indicator on its timeframe. Here's the options available in the FFx indicator: Select the timeframes to be displayed (M1 to Monthly) Define the width (number of bars) for each timeframe box Alert pop up/sound/ema
FREE
Traditional MACD MT4
Daniel Lewis
4.58 (55)
MACD indicator in MetaTrader 4/5 looks different than MACD does in most other charting software. That is because the MetaTrader 4/5 version of MACD displays the MACD line as a histogram when it is traditionally displayed as a line. Additionally, the MetaTrader 4/5 version computes the Signal line using an SMA, while according to MACD definition it is supposed to be an EMA. The MetaTrader 4/5 version also does not compute a true MACD Histogram (the difference between the MACD/Signal lines). This
FREE
FFx ParabolicSAR
Eric Venturi-Bloxs
4.67 (3)
The purpose of this new version of the MT4 standard indicator provided in your platform is to display in a sub-window multiple timeframes of the same indicator. See the example shown in the picture below. But the display isn’t like a simple MTF indicator. This is the real display of the indicator on its timeframe. Here's the options available in the FFx indicator: Select the timeframes to be displayed (M1 to Monthly) Define the width (number of bars) for each timeframe box Alert pop up/sound/ema
FREE
PZ Penta O MT4
PZ TRADING SLU
2.33 (3)
The Penta-O is a 6-point retracement harmonacci pattern which usually precedes big market movements. Penta-O patterns can expand and repaint quite a bit. To make things easier this indicator implements a twist: it waits for a donchian breakout in the right direction before signaling the trade. The end result is an otherwise repainting indicator with a very reliable trading signal. The donchian breakout period is entered as an input. [ Installation Guide | Update Guide | Troubleshooting | FAQ | A
FREE
Ppr PA
Yury Emeliyanov
4.5 (2)
"Ppr PA" is a unique technical indicator created to identify "PPR" patterns on the currency charts of the MT4 trading platform. These patterns can indicate possible reversals or continuation of the trend, providing traders with valuable signals to enter the market. Features: Automatic PPR Detection:   The indicator automatically identifies and marks PPR patterns with arrows on the chart. Visual Signals:   Green and red arrows indicate the optimal points for buying and selling, respectively. Ar
FREE
Wise Men Indicator demo
Bohdan Kasyanenko
3 (2)
The indicator displays signals according to the strategy of Bill Williams on the chart. Demo version of the indicator has the same features as the paid, except that it can work only on a demo account . Signal "First Wise Man" is formed when there is a divergent bar with angulation.  Bullish divergent bar - with lower minimum and closing price in the upper half. Bearish divergent bar - higher maximum and the closing price at the bottom half. Angulation is formed when all three lines of Alligator
FREE
Rainbow MT4
Jamal El Alama
Rainbow MT4 is a technical indicator based on Moving average with period 34 and very easy to use. When price crosses above MA and MA changes color to green, it’s a signal to buy. When price crosses below MA and MA changes color to red, it’s a signal to sell. The Expert advisor ( Rainbow EA MT4) based on Rainbow MT4 indicator, as you can see in the short video below is now available here .
FREE
With this system you can spot high-probability trades in direction of strong trends. You can profit from stop hunt moves initiated by the smart money! Important Information How you can maximize the potential of the scanner, please read here: www.mql5.com/en/blogs/post/718109 Please read also the blog about the usage of the indicator: Professional Trading With Strong Momentum This FREE Version of the indicator works only on EURUSD and GBPUSD. The full version of the indicator can be found here:
FREE
OrderBlock TS Roman
Vladislav Vlastovskii
3.8 (5)
Индикатор строит блоки заказов (БЗ) по торговой системе (ТС) Романа. Поиск блоков осуществляется одновременно на двух таймфремах: текущем и старшем (определяемым в настройках). Для оптимизации и игнорирования устаревших блоков в настройках задается ограничение количества дней в пределах которых осуществляется поиск блоков. Блоки строятся по правилам ТС состоящем из трех шагов: какую свечу вынесли (что?); какой свечой вынесли (чем?); правило отрисовки (как?).
FREE
GS spread
Aleksander Gladkov
The indicator calculates the current spread for each tick using the formula Spread=(ASK-BID)/Point. Schedule of changes in the boundaries spread over the timeframe displayed in a separate window from the date of accession of the indicator. Two lines corresponding to the minimum and maximum spread values are displayed. The indicator window is self-adjusted according to the minimum and maximum values from the moment of launch. The minimum and maximum values for the entire period of the indicator o
FREE
하모닉 패턴은 시장 반전점을 예측하는 데 가장 적합합니다. 이러한 패턴은 높은 승률과 하루 동안 다양한 거래 기회를 제공합니다. 저희 인디케이터는 하모닉 트레이딩 문헌에 기반하여 가장 인기 있는 하모닉 패턴을 식별합니다. 중요 사항: 이 인디케이터는 다시 그리지 않으며 (D 지점에서 패턴을 감지함), 따라잡지 않습니다 (패턴이 유효하거나 취소됨). 사용 방법: MT5 차트에 인디케이터를 끌어다 놓으세요. 패턴 감지를 TRUE로 설정하세요 (ABCD; Gartley). 원하는대로 편차를 조정하세요 (높은 편차는 더 많은 패턴, 낮은 편차는 더 적은 패턴). 색상을 원하는 대로 사용자 정의하세요. 필요에 따라 ENTRY POINT, TP 및 SL에 대한 경고를 활성화하거나 비활성화하세요. 패턴 감지 시: 알고리즘은 D 지점에서 패턴을 감지합니다. 경고가 활성화되어 있으면 패턴 감지에 대한 알림을 보냅니다. 패턴이 무효화되면 "패턴 취소"라는 메시지가 포함된 경고가 트리거됩니다. 성공적인
FREE
PPR and Engulfing
Yury Emeliyanov
5 (2)
PPR 및 Engulfing 은 MetaTrader 4 (MT4) 거래 플랫폼의 통화 차트에서 "PPR" 및 "Engulfing" 패턴을 식별하도록 설계된 독특한 기술 지표입니다. 이러한 패턴은 잠재적인 추세 반전 또는 지속을 나타낼 수 있으며, 트레이더에게 시장 진입 및 퇴출을 위한 귀중한 신호를 제공합니다. 주요 특징: 자동 패턴 감지 : 지표는 PPR 및 Engulfing 패턴을 자동으로 식별하고 차트에 화살표로 표시합니다. 시각적 신호 : 녹색 위쪽 화살표는 매수 지점을 나타내고, 빨간색 아래쪽 화살표는 매도 지점을 나타냅니다. 사용자 정의 가능한 화살표 색상 : 사용자는 지표 설정을 통해 강세 및 약세 신호의 화살표 색상을 선택할 수 있습니다. 모드 선택 : 세 가지 작동 모드 – PPR만, Engulfing만, 또는 두 패턴을 동시에 분석합니다. 사용 방법: 차트에 추가 : 지표를 원하는 통화 쌍 또는 금융 상품의 차트에 적용합니다. 신호 분석 : 차트에서 화살표의 출현을
FREE
Show Pips
Roman Podpora
4.26 (58)
이 정보 표시기는 계정의 현재 상황을 항상 알고 싶어하는 사람들에게 유용합니다. 표시기는 포인트, 백분율, 통화 단위의 이익뿐만 아니라 현재 쌍의 스프레드와 현재 기간에서 막대가 마감될 때까지의 시간과 같은 데이터를 표시합니다. 버전 MT5 -   더욱 유용한 지표 차트에 정보선을 배치하는 데는 여러 가지 옵션이 있습니다. 가격 오른쪽(가격보다 뒤에 있음) 코멘트로(차트의 왼쪽 상단에 있음) 화면의 선택된 모서리에 있습니다. 정보 구분 기호를 선택할 수도 있습니다. | / . \ # 표시기에는 다음과 같은 단축키가 내장되어 있습니다. 키 1 - 정보 표시 유형으로 뒤로 이동(가격, 설명 또는 코너 오른쪽) 키 2 - 정보 표시 유형에서 앞으로 나아갑니다. 키 3 - 정보 라인 표시 위치 변경 단축키는 설정에서 다시 할당할 수 있습니다. 이 표시기는 사용하기 쉽고 매우 유익합니다. 설정에서 불필요한 정보 항목을 비활성화할 수 있습니다. 설정 표시된 정보를 교체하기 위한 단축키(뒤로
FREE
이 제품의 구매자들이 또한 구매함
Gann Made Easy
Oleg Rodin
4.82 (148)
Gann Made Easy 는 mr.의 이론을 사용하여 최고의 거래 원칙을 기반으로 하는 전문적이고 사용하기 쉬운 Forex 거래 시스템입니다. W.D. 간. 이 표시기는 Stop Loss 및 Take Profit Levels를 포함하여 정확한 BUY 및 SELL 신호를 제공합니다. PUSH 알림을 사용하여 이동 중에도 거래할 수 있습니다. 거래 팁, 보너스, GANN MADE EA를 무료로 받으시려면 구매 후 저에게 연락주세요! 아마도 Gann 거래 방법에 대해 이미 여러 번 들었을 것입니다. 일반적으로 Gann의 이론은 초보자 거래자뿐만 아니라 이미 거래 경험이 있는 사람들에게도 매우 복잡한 것입니다. Gann의 거래 방식은 이론적으로 적용하기 쉽지 않기 때문입니다. 나는 그 지식을 연마하고 Forex 지표에 최고의 원칙을 적용하기 위해 몇 년을 보냈습니다. 표시기는 적용하기가 매우 쉽습니다. 차트에 첨부하고 간단한 거래 권장 사항을 따르기만 하면 됩니다. 지표는 지속적으로 시장
M1 Sniper
Oleg Rodin
4.89 (18)
M1 SNIPER 는 사용하기 쉬운 거래 지표 시스템입니다. M1 시간대에 맞춰 설계된 화살표 지표입니다. 이 지표는 M1 시간대 스캘핑을 위한 단독 시스템으로 사용할 수 있으며, 기존 거래 시스템의 일부로도 사용할 수 있습니다. 이 거래 시스템은 M1 시간대 거래용으로 특별히 설계되었지만, 다른 시간대에도 사용할 수 있습니다. 원래는 XAUUSD와 BTCUSD 거래를 위해 이 방법을 설계했지만, 다른 시장 거래에도 유용하다는 것을 알게 되었습니다. 이 지표의 신호는 추세 방향과 반대로 거래될 수 있습니다. 저는 지표의 신호를 활용하여 양방향으로 거래할 수 있도록 돕는 특별한 거래 기법을 알려드립니다. 이 방법은 특별한 동적 지지선과 저항선 가격 영역을 활용하는 것을 기반으로 합니다. 구매하시면 M1 SNIPER 화살표 지표를 바로 다운로드하실 수 있습니다. 또한, 아래 스크린샷에 표시된 Apollo Dynamic SR 지표는 M1 SNIPER 도구를 사용하는 모든 사용자에게 무료로
Game Changer Indicator
Vasiliy Strukov
5 (7)
Game Changer는 모든 금융 상품에 사용하도록 설계된 혁신적인 추세 지표로, 메타트레이더를 강력한 추세 분석기로 탈바꿈시켜 줍니다. 이 지표는 재작성이나 지연 현상이 발생하지 않습니다. 모든 시간대에서 작동하며 추세 파악을 지원하고, 잠재적 반전 신호를 제공하며, 트레일링 스톱 메커니즘으로 활용되고, 신속한 시장 반응을 위한 실시간 알림을 제공합니다. 숙련된 투자자, 전문가, 또는 우위를 점하려는 초보자 등 누구나 이 도구를 통해 자신감과 원칙을 바탕으로, 그리고 근본적인 추세 역학에 대한 명확한 이해를 바탕으로 거래할 수 있습니다. 구매 후 바로 연락 주시면 개인 보너스를 드립니다! 강력한 지지선과 추세 스캐너 지표를 무료로 받으실 수 있습니다. 개인 메시지로 알려주세요 저는 텔레그램에서 EA나 특별 세트를 판매하지 않습니다. Mql5에서만 사용 가능하며, 세트 파일은 제 블로그에서만 볼 수 있습니다 . 사기꾼을 조심하시고 다른 사람에게서 세트를 구매하지 마세요 설정 추세
Meravith
Ivan Stefanov
5 (1)
이 인디케이터는 각 지점에서 볼륨을 분석하고 해당 볼륨에 대한 시장의 피로 레벨을 계산합니다. 이 인디케이터는 세 개의 라인으로 구성됩니다: 강세 볼륨 피로 라인 약세 볼륨 피로 라인 시장 추세를 나타내는 라인. 이 라인은 시장이 강세인지 약세인지에 따라 색이 변합니다. 원하는 시작 지점에서 시장을 분석할 수 있습니다. 볼륨 피로 라인에 도달하면 다음 분석을 시작할 새 지점을 식별하세요. 트렌드와 수정 모두 분석할 수 있습니다. 좋은 접근 방법은 트렌드 라인에 도달하거나 고점 또는 저점에 도달할 때마다 인디케이터를 이동시키는 것입니다. 트렌드 라인과 볼륨 피로 라인 간의 거리가 클수록 해당 방향의 볼륨이 더 큽니다. 트렌드 라인은 주문을 열기 위한 장소로 사용할 수 있으며, 피로 라인은 수익을 얻는 데 사용됩니다. 이 시스템은 정말 독특하지만 매우 직관적입니다. 시장에는 비슷한 제품이 없습니다. 사용에 제한이 없습니다. 모든 시장과 모든 시간 프레임에서 적용할 수 있습니다. 중요:
Scalper Inside PRO
Alexey Minkov
4.74 (69)
An exclusive indicator that utilizes an innovative algorithm to swiftly and accurately determine the market trend. The indicator automatically calculates opening, closing, and profit levels, providing detailed trading statistics. With these features, you can choose the most appropriate trading instrument for the current market conditions. Additionally, you can easily integrate your own arrow indicators into Scalper Inside Pro to quickly evaluate their statistics and profitability. Scalper Inside
현재 20% 할인 ! 초보자 또는 전문가 트레이더를 위한 최고의 솔루션! 이 대시보드 소프트웨어는 28개의 통화 쌍에서 작동합니다. 2가지 주요 지표(Advanced Currency Strength 28 및 Advanced Currency Impulse)를 기반으로 합니다. 전체 Forex 시장에 대한 훌륭한 개요를 제공합니다. 고급 통화 강도 값, 통화 이동 속도 및 모든(9) 시간대의 28 Forex 쌍에 대한 신호를 보여줍니다. 추세 및/또는 스캘핑 기회를 정확히 파악하기 위해 차트의 단일 지표를 사용하여 전체 시장을 볼 수 있을 때 거래가 어떻게 개선될지 상상해 보십시오! 잠재적인 거래를 식별하고 확인하면서 강력한 통화와 약한 통화를 더욱 쉽게 식별할 수 있도록 이 지표에 기능을 내장했습니다. 이 표시기는 통화의 강세 또는 약세가 증가 또는 감소하는지 여부와 모든 시간대에서 수행되는 방식을 그래픽으로 보여줍니다. 추가된 새로운 기능은 현재 시장 조건 변화에 적응하는
Currency Strength Exotics
Bernhard Schweigert
4.88 (33)
현재 20% 할인! 초보자 또는 전문가 트레이더를 위한 최고의 솔루션! 이 표시기는 Exotic Pairs Commodities, Indexes 또는 Futures와 같은 기호에 대한 통화 강도를 표시하는 데 특화되어 있습니다. 금, 은, 석유, DAX, US30, MXN, TRY, CNH 등의 진정한 통화 강도를 보여주기 위해 9번째 줄에 모든 기호를 추가할 수 있습니다. 이것은 독특하고 고품질이며 저렴한 거래 도구입니다. 우리는 많은 독점 기능과 새로운 공식을 통합했습니다. 새로운 추세 또는 스캘핑 기회의 정확한 트리거 포인트를 정확히 찾아낼 수 있기 때문에 거래가 어떻게 개선될지 상상해 보십시오. 사용 설명서: 여기를 클릭 https://www.mql5.com/en/blogs/post/708876 모든 시간대에 작동합니다. TREND를 빠르게 확인할 수 있습니다! 새로운 기본 알고리즘을 기반으로 설계되어 잠재적인 거래를 더욱 쉽게 식별하고 확인할 수 있습니다. 8개의
Advanced Supply Demand
Bernhard Schweigert
4.91 (296)
현재 33% 할인! 초보자나 전문 트레이더를 위한 최고의 솔루션! 이 보조지표는 우리가 다수의 독창적 기능과 새로운 공식을 통합한 독특하고 고품질이며 저렴한 거래 도구입니다. 이 업데이트를 통해 이중 시간대를 표시할 수 있습니다. 더 높은 TF를 표시할 수 있을 뿐만 아니라 차트 TF와 더 높은 TF 모두를 표시할 수 있습니다: 중첩 영역 표시. 모든 Supply Demand 트레이더들이 좋아할 것입니다. :) 중요한 정보 공개 Advanced Supply Demand의 잠재력을 극대화하려면 다음을 방문하십시오. https://www.mql5.com/ko/blogs/post/720245   진입 또는 목표의 명확한 트리거 포인트를 정확히 찾아냄으로 해서 거래가 어떻게 개선될지 상상해 보십시오. 새로운 알고리즘을 기반으로 매수자와 매도자 간의 잠재적인 불균형을 훨씬 더 쉽게 분간할 수 있습니다. 왜냐하면 가장 강한 공급영역과 가장 강한 수요 영역과 과거에 어떻게 진행 되었는지를(이전
Trend indicator AI
Ramil Minniakhmetov
5 (74)
트렌드 인공 지능 지표는 실행 가능한 진입 점 및 반전 경고와 추세 식별을 결합하여 상인의 시장 분석을 향상시킬 훌륭한 도구입니다. 이 표시기는 사용자가 자신감과 정밀도로 외환 시장의 복잡성을 탐색 할 수 있도록 지원합니다 기본 신호 외에도 트렌드 인공 지능 지표는 풀백 또는 되돌림 중에 발생하는 2 차 진입 점을 식별하여 거래자가 기존 트렌드 내에서 가격 수정을 활용할 수 있도록합니다. 중요한 장점: ·작동 4 및 5 *명확한 구매 또는 판매 신호 *다시 칠하지 않습니다 *모든 자산에서 작동 나는 전보 사기에 개 또는 세트를 판매하지 않도록주의. 모든 설정은 블로그에 여기에 무료.  중요! 지침 및 보너스를 얻기 위해 구입 후 즉시 저에게 연락! 진짜 가동 감시는 뿐 아니라 나의 다른 제품 여기에서 찾아낼 수 있습니다: https://www.mql5.com/en/users/mechanic/seller&nbsp ; 설정 및 입력: 모든 자산에 대해 기본 설정을 권
M1 Arrow
Oleg Rodin
5 (19)
시장의 두 가지 기본 원칙에 기반한 일중 전략. 알고리즘은 추가 필터를 사용하여 거래량 및 가격 파동 분석을 기반으로 합니다. 지표의 지능형 알고리즘은 두 가지 시장 요인이 하나로 결합될 때만 신호를 제공합니다. 지표는 더 높은 시간 프레임의 데이터를 사용하여 M1 차트에서 특정 범위의 파도를 계산합니다. 그리고 파동을 확인하기 위해 지표는 볼륨 분석을 사용합니다. 이 표시기는 준비된 거래 시스템입니다. 트레이더가 필요로 하는 모든 것은 신호를 따르는 것입니다. 또한 지표는 자신의 거래 시스템의 기초가 될 수 있습니다. 거래는 분 차트에서만 수행됩니다. 지표가 MTF 원리를 사용한다는 사실에도 불구하고 지표 알고리즘은 가능한 한 안정적입니다. 구매 후 반드시 저에게 편지를 보내주세요! 내 거래 설정 및 권장 사항을 공유하겠습니다!
이 지표를 구매하면 제 프로페셔널 트레이드 매니저를 무료로 드립니다. 우선 이 거래 시스템이 리페인팅, 리드로잉 및 레이그 인디케이터가 아니라는 점을 강조하는 것이 중요합니다. 이는 수동 및 로봇 거래 모두에 이상적인 것으로 만듭니다. 온라인 강좌, 설명서 및 프리셋 다운로드. "스마트 트렌드 트레이딩 시스템 MT5"은 새로운 및 경험이 풍부한 트레이더를 위해 맞춤형으로 제작된 종합적인 거래 솔루션입니다. 10개 이상의 프리미엄 인디케이터를 결합하고 7개 이상의 견고한 거래 전략을 특징으로 하여 다양한 시장 조건에 대한 다목적 선택이 가능합니다. 트렌드 추종 전략: 효과적인 트렌드 추이를 타기 위한 정확한 진입 및 손절 관리를 제공합니다. 반전 전략: 잠재적인 트렌드 반전을 식별하여 트레이더가 범위 시장을 활용할 수 있게 합니다. 스캘핑 전략: 빠르고 정확한 데이 트레이딩 및 단기 거래를 위해 설계되었습니다. 안정성: 모든 인디케이터가 리페인팅, 리드로잉 및 레이그가 아니므로 신뢰
이 지표는 실제 거래에 완벽한 자동 파동 분석 지표입니다! 사례... 참고:   웨이브 그레이딩에 서양식 이름을 사용하는 데 익숙하지 않습니다. Tang Lun(Tang Zhong Shuo Zen)의 명명 규칙의 영향으로 기본 웨이브를   펜   으로 명명하고 2차 웨이브 밴드를   세그먼트   로 명명했습니다. 동시에, 세그먼트에는 추세 방향이 있습니다.   주요 추세 세그먼트에는   이름이 지정되지만(이 이름 지정 방법은 향후 노트에서 사용됩니다. 먼저 말씀드리겠습니다.) 알고리즘은 굴곡 이론과 거의 관련이 없으므로 그렇게 해서는 안 됩니다. 이는 나의 시장 분석을   통해 요약된 끊임없이 변화하고 복잡한 운영 규칙을   반영합니다. 밴드는 더 이상 사람마다 다르지 않도록 표준화되고 정의되었습니다. 인위적인 간섭의 드로잉 방법은 시장 진입을 엄격하게 분석하는 데 핵심적인 역할을 합니다. 이 지표를 사용하는 것은 거래 인터페이스의 미학을 개선하고 원래의 K-line 거래를
PRO Renko System
Oleg Rodin
5 (29)
PRO Renko System 은 RENKO 차트 거래를 위해 특별히 고안된 매우 정확한 거래 시스템입니다. 이것은 다양한 거래 상품에 적용될 수있는 보편적 인 시스템입니다. 체계는 효과적으로 당신에게 정확한 반전 신호에 접근을 주는 소위 시장 소음을 중화합니다. 이 표시기는 사용하기가 매우 쉽고 신호 생성을 담당하는 매개 변수가 하나만 있습니다. 당신은 쉽게 당신의 선택의 어떤 무역 계기에 공구를 적응시킬 수 있고 renko 막대기의 크기. 나는 항상 당신이 내 소프트웨어로 수익성있게 거래 할 수 있도록 추가 지원을 제공 할 준비가되어 있습니다! 나는 당신에게 행복하고 수익성있는 거래를 기원합니다! 구매 후 저에게 연락하십시오! 내 렌코 차트 생성기를 보내드립니다. 또한 내 개인 권장 사항 및 시스템의 다른 모듈을 무료로 공유 할 것입니다!
FX Power MT4 NG
Daniel Stein
4.95 (20)
FX Power: 통화 강세 분석으로 더 스마트한 거래 결정을 개요 FX Power 는 어떤 시장 상황에서도 주요 통화와 금의 실제 강세를 이해하기 위한 필수 도구입니다. 강한 통화를 매수하고 약한 통화를 매도함으로써 FX Power 는 거래 결정을 단순화하고 높은 확률의 기회를 발견합니다. 트렌드를 따르거나 극단적인 델타 값을 사용해 반전을 예측하고자 한다면, 이 도구는 귀하의 거래 스타일에 완벽히 적응합니다. 단순히 거래하지 말고, FX Power 로 더 스마트하게 거래하세요. 1. FX Power가 거래자에게 매우 유용한 이유 통화와 금의 실시간 강세 분석 • FX Power 는 주요 통화와 금의 상대적 강세를 계산하고 표시하여 시장 역학에 대한 명확한 통찰력을 제공합니다. • 어떤 자산이 앞서고 있고 어떤 자산이 뒤처지는지 모니터링하여 보다 현명한 거래 결정을 내릴 수 있습니다. 포괄적인 멀티 타임프레임 뷰 • 단기, 중기 및 장기 타임프레임에서 통화와 금의 강세를
SMC Easy Signal
Mohamed Hassan
4.73 (15)
3 copies left at $65, next price is $120 SMC Easy Signal was built to remove the confusion around the smart money concept by turning structural shifts like BOS (Break of Structure) and CHoCH (Change of Character) into simple buy and sell trading signals. It simplifies market structure trading by automatically identifying breakouts and reversals as they happen, allowing traders to focus on execution rather than analysis. Whether the market is continuing its trend or preparing to reverse, the i
Looking for a powerful yet lightweight swing detector that accurately identifies market structure turning points? Want clear, reliable buy and sell signals that work across any timeframe and any instrument? Buy Sell Arrow MT Swing is built exactly for that — precision swing detection made simple and effective. This indicator identifies Higher Highs (HH) , Higher Lows (HL) , Lower Highs (LH) , and Lower Lows (LL) with remarkable clarity. It is designed to help traders easily visualize market str
Dynamic Forex28 Navigator
Bernhard Schweigert
4.43 (7)
Dynamic Forex28 Navigator - 차세대 외환 거래 도구. 현재 49% 할인. Dynamic Forex28 Navigator는 오랫동안 인기 있는 지표의 진화형으로, 세 가지의 힘을 하나로 결합했습니다. 고급 통화 Strength28 지표(695개 리뷰) + 고급 통화 IMPULSE with ALERT(520개 리뷰) + CS28 콤보 신호(보너스). 지표에 대한 자세한 정보 https://www.mql5.com/en/blogs/post/758844 차세대 Strength 지표는 무엇을 제공합니까?  원래 지표에서 좋아했던 모든 것이 새로운 기능과 더 높은 정확도로 강화되었습니다. 주요 기능: 독점적인 통화 Strength 공식.  모든 시간대에 걸쳐 부드럽고 정확한 강도선. 추세와 정확한 진입을 식별하는 데 이상적입니다. 역동적인 시장 피보나치 수준(시장 피보나치).  이 지표에만 있는 고유한 기능. 가격 차트가 아닌 통화 강도에 피보나치가 적용됩니다.
ACB Breakout Arrows
KEENBASE SOFTWARE SOLUTIONS
4.15 (34)
ACB Breakout Arrows 지표는 특별한 돌파 패턴을 감지하여 시장에서 매우 중요한 진입 신호를 제공합니다. 이 지표는 차트를 지속적으로 스캔하며 한 방향으로 안정적인 모멘텀이 형성되는지를 확인하고, 주요 움직임 직전에 정확한 진입 신호를 제공합니다.  다중 심볼 및 다중 타임프레임 스캐너 받기 – ACB Breakout Arrows MT4용 스캐너 주요 기능 지표가 자동으로 손절(Stop Loss) 및 이익실현(Take Profit) 레벨을 제공합니다. 모든 시간대의 돌파 신호를 추적하는 MTF 스캐너 대시보드가 포함되어 있습니다. 단타 트레이더, 스윙 트레이더, 스캘퍼에게 적합합니다. 정확도를 높이기 위한 최적화된 알고리즘 사용. 손익분기(Breakeven) 또는 단기 목표를 위한 특수 라인(퀵 프로핏 라인) 제공. 승률, 성공률, 평균 수익 등과 같은 성과 분석 지표 제공. 리페인트 없음 – 한번 생성된 신호는 사라지지 않습니다. 거래 확인 -  신뢰도 낮은 신호를
Currency Strength Wizard
Oleg Rodin
4.84 (55)
통화 강도 마법사는 성공적인 거래를 위한 올인원 솔루션을 제공하는 매우 강력한 지표입니다. 표시기는 여러 시간 프레임의 모든 통화 데이터를 사용하여 이 또는 해당 외환 쌍의 힘을 계산합니다. 이 데이터는 특정 통화의 힘을 확인하는 데 사용할 수 있는 사용하기 쉬운 통화 지수 및 통화 전력선의 형태로 표시됩니다. 필요한 것은 거래하려는 차트에 표시기를 부착하는 것뿐입니다. 표시기는 거래하는 통화의 실제 강세를 보여줍니다. 지표는 또한 추세와 거래할 때 유리하게 사용할 수 있는 구매 및 판매 거래량 압력의 극한값을 보여줍니다. 지표는 또한 피보나치에 기반한 가능한 대상을 보여줍니다. 표시기는 PUSH 알림을 포함한 모든 유형의 알림을 제공합니다. 구매 후 연락주세요. 나는 당신과 거래 팁을 공유하고 당신에게 무료로 훌륭한 보너스 지표를 줄 것입니다! 나는 당신에게 행복하고 유익한 거래를 기원합니다!
Advanced Currency Strength28 Indicator
Bernhard Schweigert
4.91 (657)
현재 26% 할인 초보자 또는 전문가 트레이더를 위한 최고의 솔루션! 이 지표는 우리가 독점 기능과 새로운 공식을 통합했기 때문에 독특하고 고품질이며 저렴한 거래 도구입니다. 단 하나의 차트로 28 Forex 쌍의 통화 강도를 읽을 수 있습니다! 새로운 추세 또는 스캘핑 기회의 정확한 트리거 포인트를 정확히 찾아낼 수 있기 때문에 거래가 어떻게 개선될지 상상해 보십시오. 사용 설명서: 여기를 클릭  https://www.mql5.com/en/blogs/post/697384 그것이 첫 번째, 원본입니다! 쓸모없는 지망생 클론을 사지 마십시오. 더 스페셜  강력한 통화 모멘텀을 보여주는 하위 창의 화살표 GAP가 거래를 안내합니다! 기본 또는 호가 통화가 과매도/과매도 영역(외부 시장 피보나치 수준)에 있을 때 개별 차트의 기본 창에 경고 표시가 나타납니다. 통화 강도가 외부 범위에서 떨어질 때 풀백/반전 경고. 교차 패턴의 특별 경고 추세를 빠르게 볼 수 있는 다중 시간
Trend Screener
STE S.S.COMPANY
4.79 (95)
트렌드 표시기, 트렌드 트레이딩 및 필터링을 위한 획기적인 고유 솔루션, 하나의 도구 안에 내장된 모든 중요한 트렌드 기능! Forex, 상품, 암호 화폐, 지수 및 주식과 같은 모든 기호/도구에 사용할 수 있는 100% 다시 칠하지 않는 다중 시간 프레임 및 다중 통화 표시기입니다. 기간 한정 특가: 지원 및 저항 스크리너 지표는 단 100달러에 평생 제공됩니다. (원래 가격 50 달러) (제안 연장) Trend Screener는 차트에 점이 있는 화살표 추세 신호를 제공하는 효율적인 지표 추세 추종 지표입니다. 추세 분석기 표시기에서 사용할 수 있는 기능: 1. 트렌드 스캐너. 2. 최대 이익 분석이 있는 추세선. 3. 추세 통화 강도 측정기. 4. 경고가 있는 추세 반전 점. 5. 경고가 있는 강력한 추세 점. 6. 추세 화살표 Trend Screener Indicator가 있는 일일 분석 예, 일일 신호 성능...등은 여기에서 찾을 수 있습니다.   여기를 클릭하십시오. L
Smc Blast Signal
Mohit Dhariwal
SMC Blast Signal with FVG, BOS and trend Breakout The SMC Blast Signal  is a  Precise trading system for Meta Trader 4 that uses Smart Money Concepts (SMC) , including Fair Value Gaps (FVG) and Break of Structure (BOS) , to identify high-probability trades. It incorporates a Trend Filter using a higher timeframe moving average, ensuring trades align with the prevailing market trend. TREND SIGNAL-FVG DETECTION-BOS DETECTION-TRADE CONFIRMED-Precise Signal entries on m15  Best TF-M15 AND ABOVE Be
Day Trader Master
Oleg Rodin
5 (15)
Day Trader Master 는 데이 트레이더를 위한 완벽한 거래 시스템입니다. 시스템은 두 개의 지표로 구성됩니다. 하나의 지표는 매수 및 매도를 위한 화살표 신호입니다. 얻을 수 있는 화살표 표시기입니다. 2차 지표를 무료로 드립니다. 두 번째 지표는 이러한 화살표와 함께 사용하도록 특별히 설계된 추세 지표입니다. 표시기는 반복하지 않고 늦지 않습니다! 이 시스템을 사용하는 것은 매우 간단합니다. 2색 선으로 표시되는 현재 추세 방향의 화살표 신호를 따라가기만 하면 됩니다. 파란색은 구매 추세입니다. 빨간색은 판매 추세입니다. 파란색 화살표는 매수 신호입니다. 빨간색 화살표는 매도 신호입니다. 추세선의 색상과 일치하려면 화살표의 색상과 신호의 방향이 필요합니다. 화살표 표시기는 주로 시간 간격 M5 및 M15에서 일중 거래를 위해 만들어졌습니다. 그러나 기술적으로 시스템은 다른 시간 간격으로 사용할 수 있습니다. 표시기에는 PUSH 메시지 기능이 있는 팝업 경고가 장착되어 있
Market Structure Break Out
Ashkan Hazegh Nikrou
5 (8)
**Market Structure Break Out (MSB)**는 MT4 및 MT5 용으로 설계된 고급 도구로, 트레이더가 시장 움직임을 구조적으로 이해하고, 화살표와 알림 을 통해 추세 방향 또는 반대 방향의 훌륭한 거래 신호를 찾을 수 있도록 도와줍니다. 이 제품의 또 다른 핵심 기능은 지속되는 공급 및 수요 영역을 그리는 기능 입니다. 또한, 실시간 백테스트 기능 을 통해 과거의 성능을 차트에서 직접 확인할 수 있어 트레이더에게 신뢰와 투명성을 제공합니다. 무료 EA 받기: 무료 Market Structure Breakout EA 를 받아보세요. 이 EA는 돌파 화살표를 기반으로 고정 로트 크기와 사용자 지정 가능한 손절매 및 이익 실현 수준으로 자동으로 거래를 엽니다. 수령 방법: 여기를 클릭하여 EA를 다운로드하세요. 이 EA 는 Market Structure Break Out 인디케이터 를 이미 구매한 경우에만 작동합니다. 이 제품의 MT5 버전은 여기에서 확인하세
특별 할인 : ALL TOOLS , 개당 $35 ! 신규 도구   는   $30   로   첫 주   또는   첫 3회 구매 에 제공됩니다!  Trading Tools Channel on MQL5 : 최신 소식을 받으려면 제 MQL5 채널에 참여하세요 Volumatic Support/Resistance Levels Scanner는 가격 구조에 거래량 맥락을 추가하는 지지/저항 지표입니다. 최근 피벗 주위에 거래 활동이 어떻게 모이는지를 보여 주어 매수 또는 매도 관심이 가장 활발한 지점을 파악할 수 있습니다. MT5 버전 보기:  Volumatic Support Resistance Levels MT5 Scanner 더 많은 제품 보기:   All P roducts 1 · 개요 이 지표는 최근 고점과 저점에서 가격 영역을 그린 뒤 각 영역에 거래량 히스토그램을 오버레이합니다. 히스토그램 두께는 현재 활동에 따라 늘어나거나 줄어들어 시장이 특정 레벨에 얼마나 주목하는지 판단할 수 있습
Entry Points Pro
Yury Orlov
4.62 (172)
다시 색을 칠하지 않고 거래에 진입할 수 있는 정확한 신호를 제공하는 MT4용 지표입니다. 외환, 암호화폐, 금속, 주식, 지수 등 모든 금융 자산에 적용할 수 있습니다. 매우 정확한 추정값을 제공하고 매수와 매도의 가장 좋은 시점을 알려줍니다. 하나의 시그널로 수익을 내는 지표의 예와 함께 비디오 (6:22)시청하십시오! 대부분의 거래자는 Entry Points Pro 지표의 도움으로 첫 거래 주 동안 트레이딩 결과를 개선합니다. 저희의   Telegram Group 을 구독하세요! Entry Points Pro 지표의 좋은점. 재도색이 없는 진입 신호 신호가 나타나고 확인되면(시그널 캔들이 완성된 경우) 신호는 더 이상 사라지지 않습니다. 여타 보조지표의 경우 신호를 표시한 다음 제거되기 때문에 큰 재정적 손실로 이어집니다. 오류 없는 거래 게시 알고리즘을 통해 트레이드(진입 또는 청산)를 할 이상적인 순간을 찾을 수 있으며, 이를 통해 이를 사용하는 모든 거래자의 성공률이
Hidden Cycles
Lev Vladimirovic Marushkin
5 (1)
Black Friday Sale – Limited Time! Grab Hidden Cycles for only $129 (regular price $179 ). This is your chance to boost your strategy with a powerful, easy-to-use cycle-based trading tool. Offer ends soon — don’t miss it! Based on Universal Laws — NOT Some Guy’s Algorithm: Let the market adjust to the Hidden Cycles Geometry — not the other way around. Most indicators are based on a man-made formula. They often lag, fail over time, or need constant re-optimization.  Hidden Cycles is different.
Adaptive Volatility Range
Stanislav Konin
5 (3)
Adaptive Volatility Range [AVR] is a powerful tool for identifying key trend reversal points. AVR accurately reflects the Average True Range (ATR) of volatility, taking into account the Volume-Weighted Average Price (VWAP). The indicator adapts to any market volatility by calculating the average volatility over a specific period, ensuring a stable rate of profitable trades. You receive not just an indicator but a professional automated trading system , AVR-EA . Advantages: Automated Trading Sys
Advanced Currency IMPULSE with ALERT
Bernhard Schweigert
4.91 (489)
현재 31% 할인!! 초보자 또는 전문가 트레이더를 위한 최고의 솔루션! 이 지표는 우리가 독점 기능과 비밀 공식을 통합했기 때문에 독특하고 고품질이며 저렴한 거래 도구입니다. 단 하나의 차트로 28개 통화 쌍 모두에 대한 경고를 제공합니다. 새로운 추세 또는 스캘핑 기회의 정확한 트리거 포인트를 정확히 찾아낼 수 있기 때문에 거래가 어떻게 개선될지 상상해 보십시오! 새로운 기본 알고리즘을 기반으로 구축되어 잠재적인 거래를 훨씬 더 쉽게 식별하고 확인할 수 있습니다. 이는 통화의 강세 또는 약세가 가속되는지 여부를 그래픽으로 표시하고 가속 속도를 측정하기 때문입니다. 자동차의 속도계처럼 생각하면 됩니다. 가속화할 때 Forex 시장에서 동일한 일이 분명히 더 빠르게 발생합니다. 즉, 반대 방향으로 가속화되는 통화를 페어링하면 잠재적으로 수익성 있는 거래를 식별한 것입니다. 통화 모멘텀의 수직선과 화살표가 거래를 안내합니다! 역동적인 Market Fibonacci 23 레벨은
Binary Trader Master 는 촛불 종가를 예측하는 화살표 기반 지표입니다. 하나의 캔들 내에서만 분석을 수행합니다. 양초가 열리면 분석을 수행하고 양초 종가를 예측하는 데 약간의 시간이 필요합니다. 그런 다음 신호를 생성합니다. 이 지표를 사용하면 분석에 사용할 수 있는 시간 제한을 적용할 수 있습니다. 즉, 캔들 내 분석에 허용되는 시간을 지표에 실제로 알릴 수 있습니다. 표시기는 양초의 특수 볼륨 패턴을 모니터링합니다. 이 분석은 실제로 현재(0) 캔들의 종가를 예측합니다. 이러한 양초는 일반적으로 거래량이 많기 때문에 이러한 신호는 잠재적인 수익도 좋고 외환 거래에도 사용할 수 있습니다. 바이너리 및 외환 거래자 모두 이 표시기의 혜택을 받을 수 있습니다. 인디케이터가 개별 캔들 본체와 함께 작동하기 때문에 인디케이터는 실시간 또는 시각적 전략 테스트 모드에서만 신호를 제공합니다! 신호는 다시 칠하지 마십시오! 구매 후 연락주세요! 나는 당신에게 거래 지침을 제공하
제작자의 제품 더 보기
VisualTicksEA
Dariusz Grywaczewski
VisualTicks_EA is an Expert Advisor dedicated to the VisualTicks chart. Works ONLY on the VisualTicks chart. Is a tool that lets you open and close transactions directly on the VisualTicks chart. There is only one parameter in EA settings: magic - next EA number. If you use more than one VisualTicks_EA on MT4, you must enter a different magic number. After starting VisualTicks_EA, the following buttons will appear on the chart: Open BUY - opens one BUY transaction of a specified lot size. Cl
FREE
Sequence Project
Dariusz Grywaczewski
This Expert Advisor is a very advanced sequential tool that gives each user the possibility to program the order of tasks according to specific conditions. Everything can be done in a simple and intuitive way. The sequencing of the EA's programming ensures that each operation is carried out one after another. I present the method of operation in the attached movie. EA global settings magic – individual EA number . For each EA attached on the same instrument, a different number must be entered
AST personov
Dariusz Grywaczewski
4 (1)
AST_personov is an indicator, which presented of the arithmetic average of the ticks. Next to the current price, a line appears with the value of the AST deviation from the current price (in points). If the value is positive, it is green and if it is negative, it is red. What is the arithmetic average of the ticks ? This is the average of the last ticks that the price move. It has nothing to do with bars ( prices Open, Close, High and Low ). Calculations are carried out using ticks. The values c
UltraDynamicSensor
Dariusz Grywaczewski
The purpose of the indicator is to measure the dynamics of price movement, capturing sudden acceleration, and examination of the direction in which the price is moving. Indicator due to its nature, is dedicated to TimeFrame M1, but it can be freely used on higher TF'ach. Calculation and display will be identical to the M1. Indicator all calculations done on ticks, ie single price movements. Are not taken into account the conditions candle (the color of the candle, the candle shape, values : ope
VisualTics
Dariusz Grywaczewski
A real rarity for scalpers. Are you looking for TFs lower than M1 ? Do you want to see the price dynamics inside the candle? This is a tool for you. Visual Ticks is an indicator that shows the tick chart in a separate window. He does it in real time waiting for changing ticks. Thanks to Visual Ticks, we can look inside the traditional candle and see the dynamics of the moving price. By setting "period_of_model" we can shape a chart made of candles. "period_of_model" defines how many consecuti
Visual Tics VIA
Dariusz Grywaczewski
A real rarity for scalpers. Are you looking for TFs lower than M1 ? Do you want to see the price dynamics inside the candle? This is a tool for you. Visual Ticks is an indicator that shows the tick chart in a separate window. He does it in real time waiting for changing ticks. Thanks to Visual Ticks, we can look inside the traditional candle and see the dynamics of the moving price. By setting "period_of_model" we can shape a chart made of candles. "period_of_model" defines how many consecuti
Open by Clik
Dariusz Grywaczewski
Open by Clik is a tool that allows you to open positions with two mouse clicks. The place of the click and the direction of clicking decide what position will be opened. Opening of positions is quick and intuitive. If the second click is above the first click, opened are positions Long. If the second click is belowe the first click, opened are positions Short. By clicking in the chart area, opened are Market Order (BUY and SELL). By clicking in the area in front of the chart, opened are Pendin
MultiTrendScanner
Dariusz Grywaczewski
MultiTrend_Scanner is an indicator for the MT4 platform that is used to review trends on multiple symbols. We turn it on on any symbol, on any TF and we have a preview of the entire market. The current symbol is permanently assigned in the first segment of scanner. When adding another segment, you can manually enter any symbol. The quantity of added segments is unlimited. In each segment of a given symbol displayed are trends on different TFs. To calculate the strength of these trends are used
필터:
리뷰 없음
리뷰 답변