MyTrendLinesMT5
- Indicadores
- Versión: 1.0
- Activaciones: 5

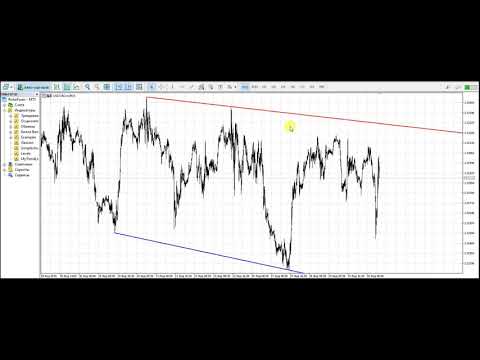
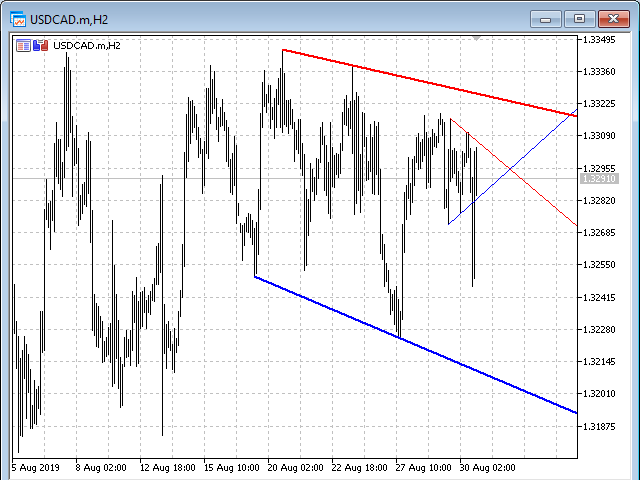
El indicador dibuja automáticamente líneas de tendencia en el marco temporal especificado(parámetro Período de líneas de tendencia ). Las líneas se dibujan basándose en los dos últimos fractales conocidos del periodo especificado. Si desea que las líneas se dibujen sólo en el fractal confirmado, establezca el parámetroFractal confirmado o no confirmado en Verdadero.
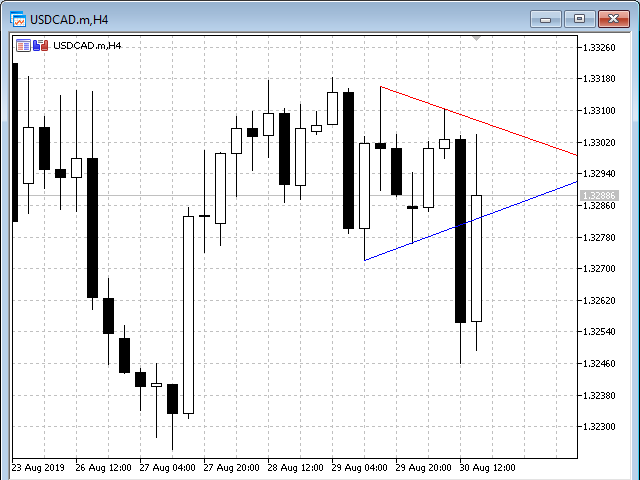
Característica del indicador - las líneas se dibujan con la precisión de cualquier marco temporal. Permite analizar el gráfico en marcos temporales más pequeños sin perder la precisión del trazado de las líneas en relación con los extremos de los precios. Es adecuado para operaciones intradía y a medio plazo.
Los parámetros de las líneas de tendencia (color, estilo, anchura) se establecen mediante los parámetros de entrada del indicador.
El indicador envía notificaciones push en caso de ruptura del precio de las líneas de tendencia. Para ello, el parámetro Activar o desactivar la notificación push debe establecerse en Verdadero.
El periodo de ruptura y la frecuencia de envío de notificaciones se configuran en los parámetros de entrada (parámetro Breakout y periodo de notificación). La notificación se envía una vez en el periodo especificado.
En un gráfico se pueden instalar varios indicadores con diferentes parámetros.
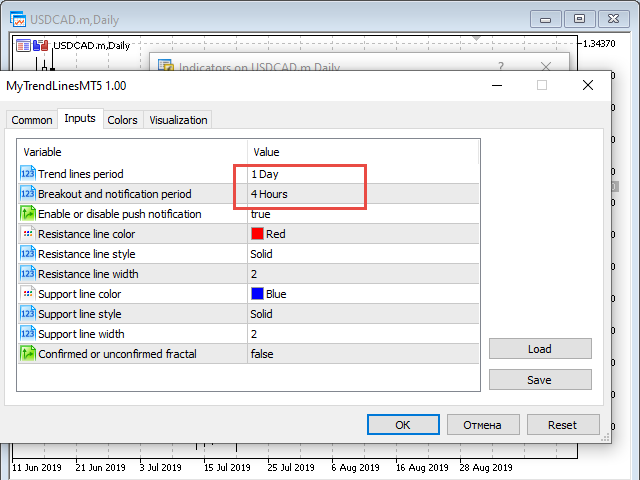
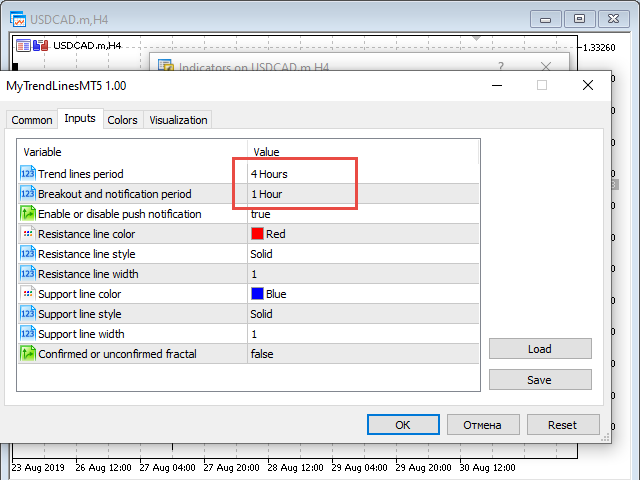
Parámetros de entrada del indicador:
- Períodode líneas de tendencia - parámetro establece el período en el que se dibujarán las líneas de tendencia;
- Período de rupturay notificación - el parámetro establece el período en el que se determinará la ruptura de las líneas de tendencia. También una vez que un período especificado se enviará una notificación;
- Activar o desactivar la notificación push - la opción activa y desactiva las notificaciones push;
- Color de la línea de resistencia - el parámetro establece el color de la línea de resistencia;
- Estilode línea de resistencia - el parámetro establece el estilo de resistencia de la línea;
- Ancho de la línea de resistencia - el parámetro establece el ancho de la línea de resistencia;
- Color de la línea de soporte - el parámetro establece el color de la línea de soporte;
- Estilode la línea de soporte - este parámetro establece el estilo de la línea de soporte;
- Anchode la línea de soporte - este parámetro establece el ancho de la línea de soporte;
- Fractal confirmado o no confirmado - el parámetro permite dibujar líneas sólo en fractales confirmados.

I am not sure how to rate this indicator. I am using it on gold as I write this review, and on the 1 hr chart I dont have a clue why it is drawing the bottom trend line upward from a specific point, but it doesnt make any sense to me how this is a proper place. In the photos, he shows the lines hitting two wicks and that makes more sense. I am looking for an indicator that helps me see what I may not see. I give it a 3 because the price was fair and it has drawn a few proper lines on the smaller time frames, but like I said, I dont know what it is doing on the 1 hr gold chart.