AOnoisyChannel
- Indikatoren
- Version: 1.2
- Aktualisiert: 3 Februar 2019
- Aktivierungen: 5

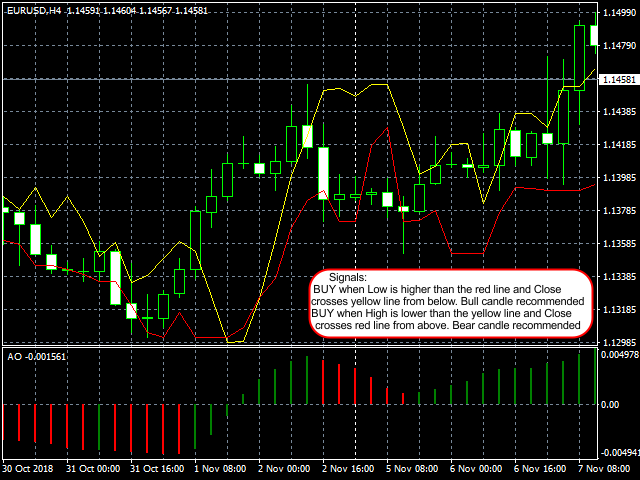
Verwenden Sie Awesome Oscillator? Fragen Sie sich, bei welchen Höchst- und Tiefstkursen dieser Indikator grün gefärbt ist? Rot? Dieser Indikator hilft Ihnen, diese Grenzen zu bestimmen.
GET 20% OFF für die Miete für 1 Jahr!
Die gelbe Linie ist die obere Linie und die rote Linie die untere Linie.
KAUFEN SIGNAL
In diesem Fall würde die AO-Farbe des letzten Balkens grün sein.
- Sowohl der Eröffnungs- als auch der Tiefstkurs liegen über der unteren Linie.
- Der Schlusskurs kreuzt die obere Linie von unten.
VERKAUFSSIGNAL
In diesem Fall wird die AO-Farbe des letzten Balkens rot eingefärbt.
- Sowohl der Eröffnungs- als auch der Höchstkurs liegen unter der oberen Linie.
- Der Schlusskurs kreuzt die untere Linie von oben.
Sonderfall
Manchmal erscheint die untere Linie höher als die obere Linie. Steigen Sie NICHT ein, wenn dies der Fall ist, da dies das Ergebnis eines vorherigen Trends oder einer Umkehrung sein kann.
Eingabe Beschreibung:
low_sensitivity: Zeichnen Sie einen breiteren Kanal.