Sly Fox ParaS EMA Trend Rider
- Indicadores
- Versión: 1.10
- Activaciones: 5

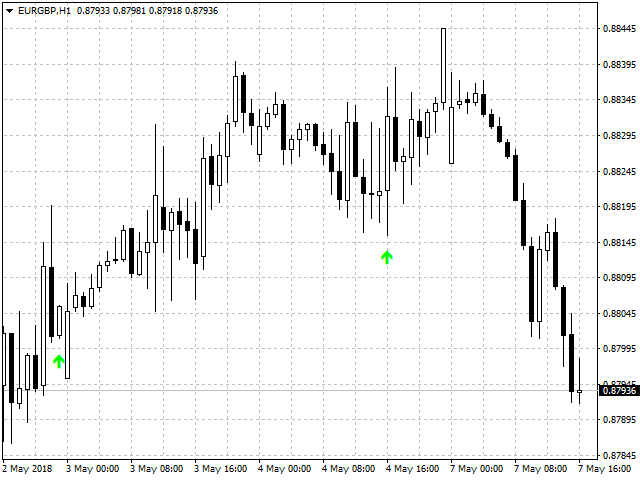
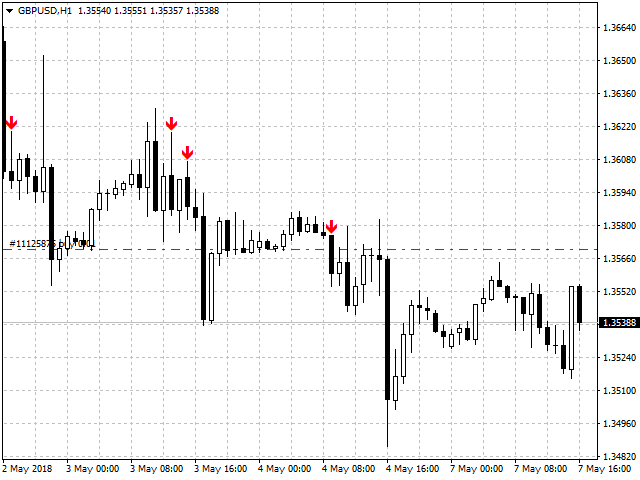
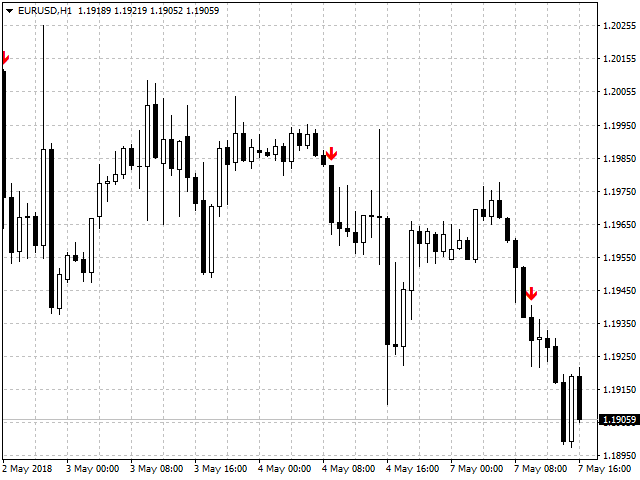
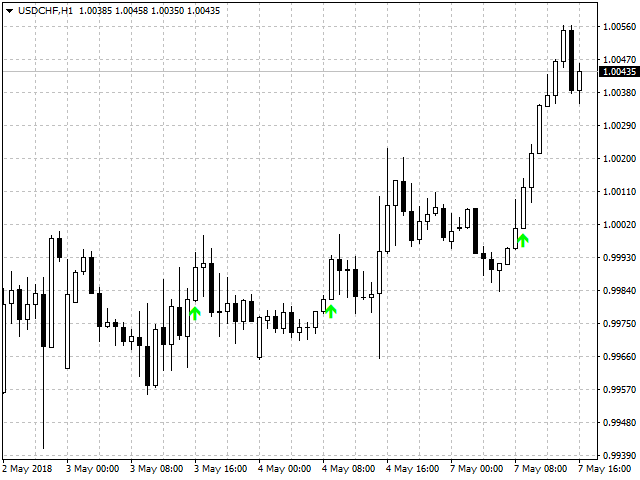
Indicador de flecha que utiliza el SAR parabólico variable y la EMA para mercados en tendencia. Mostrará la tendencia que se está estableciendo y la continuación de la tendencia, lo que le permite montar tendencias largas o cuero cabelludo.
Diseñado para:
- Scalping
- Operaciones intradía
- Operaciones a largo plazo
Eficaz para:
- Pares de divisas
- Índices
- Petróleo
- Plata
- Oro
- Cripto
Plazos recomendados:
- H1
- H4
- Diario
- Semanal
- Mensual
Para plazos más cortos, ajuste la configuración totalmente personalizable. Pruebe para encontrar los ajustes óptimos que se adapten a su estilo de negociación.
Función
La flecha se genera cuando el SAR Parabólico se activa y confirma tras el cruce de 12 EMA y 5 EMA, pero sólo cuando el precio cierra por debajo (corto) o por encima (largo) de 200 EMA y 50 EMA en la dirección de la tendencia.
Parámetros
Variables
- Usar Enviar Correo - Verdadero/Falso
- Usar Alerta - Verdadero/Falso
- Usar Notificación Push - Verdadero/Falso
- Utilizar PSAR para alerta - Verdadero/Falso
Indicador 1 = Media móvil 1
- Período_1 = 200
- Desplazamiento_1 = 0
- Ma_Method_1 = Exponencial
- Apply_to_1 = Precio de cierre
Indicador 2 = Media Móvil 2
- Periodo_2 = 50
- Desplazamiento_2 = 0
- Ma_Method_2 = Exponencial
- Apply_to_2 = Precio de cierre
Indicador 3 = Media móvil 3
- Periodo_3 = 12
- Desplazamiento_3 = 0
- Ma_Method_3 = Exponencial
- Aplicar_a_3 = Precio de cierre
Indicador 4 = Media móvil 4
- Periodo_4 = 5
- Desplazamiento_4 = 0
- Ma_Method_4 = Exponencial
- Aplicar_a_4 = Precio de cierre
Indicador 5 = Parabolic SAR Configuración
- Paso = 0.02
- Máximo = 0.2
Todos los ajustes son totalmente variables.
Para señales más precisas y operaciones a corto plazo, el SAR Parabólico puede ajustarse a 0,01/0,1. Cambiar los ajustes de EMA y SAR Parabólico le permitirá una gran flexibilidad para adaptarse a todos los estilos de negociación.
Por favor, pruebe para encontrar el estilo que más le convenga. Esto no es una 'flecha mágica' - no existen. Es más, se trata de una herramienta sencilla diseñada para ayudar a los operadores a encontrar puntos de entrada fuertes.
Opere siempre con seguridad.