ATR Channel Multiframe
- Indicadores
- Versión: 1.0
- Activaciones: 5

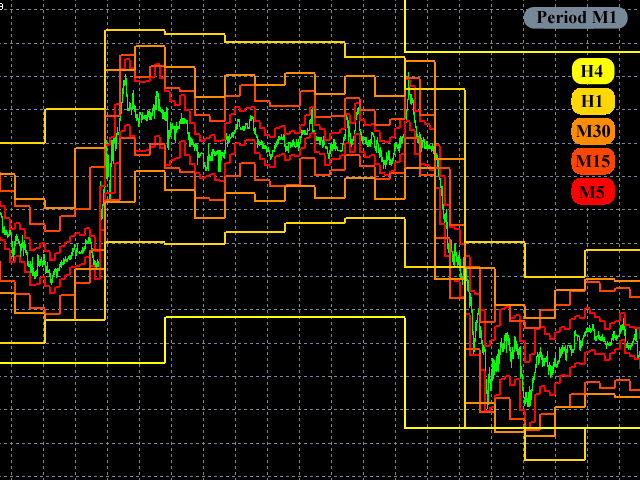
Se trata de una versión totalmente multiplataforma del indicador estándar ATR Channel, que funciona para cualquier combinación de marcos temporales.
El indicador permite ver los canales de precios de diferentes marcos temporales en una ventana, y siempre se mostrarán en una escala de tiempo correcta.
Puede crear un conjunto de intervalos y cambiar libremente a uno superior o inferior.
Tenga en cuenta: en el modo de visualización"Desde el precio medio", es fácil identificar los puntos de reversión en las intersecciones de los niveles de los plazos más altos por los niveles de los plazos más bajos.
El indicador está probado en Just2trade
Parámetros
- FromMedianPrice - canales de visualización basados en el precio medio
- ATRPeriod - periodo de cálculo del ATR
- Redraw - activar/desactivar el redibujado automático después del cierre de cada vela
- M1 - mostrar/ocultar el gráfico de 1 minuto
- M5 - mostrar/ocultar el gráfico de 5 minutos
- M15 - mostrar/ocultar el gráfico de 15 minutos
- M30 - mostrar/ocultar el gráfico de 30 minutos
- H1 - mostrar/ocultar el gráfico horario
- H4 - mostrar/ocultar el gráfico de 4 horas
- D1 - mostrar/ocultar el gráfico diario
- W1 - mostrar/ocultar el gráfico semanal
- MN - mostrar/ocultar el gráfico mensual
El usuario no ha dejado ningún comentario para su valoración