PowerSignalMT5
- Indicadores
-
Daying Cao
 ¡Hola! Soy un ingeniero de software ha estado desarrollando durante muchos years.have su propio sistema de comercio único, tiene una riqueza de EA experiencia comercial. La moneda principal es EUR / USD, GBP / USD. USD / JPY, AUD / USD, USD / CAD, oro, EUR / NZD moneda cruzada. EA corriendo para
 - Versión: 1.33
- Actualizado: 12 marzo 2021
- Activaciones: 5
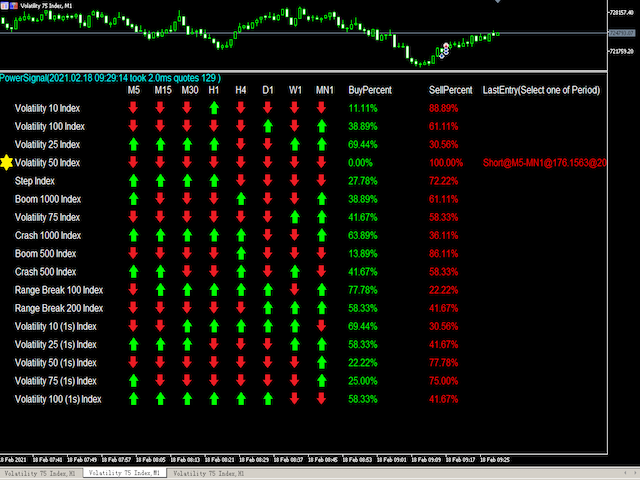
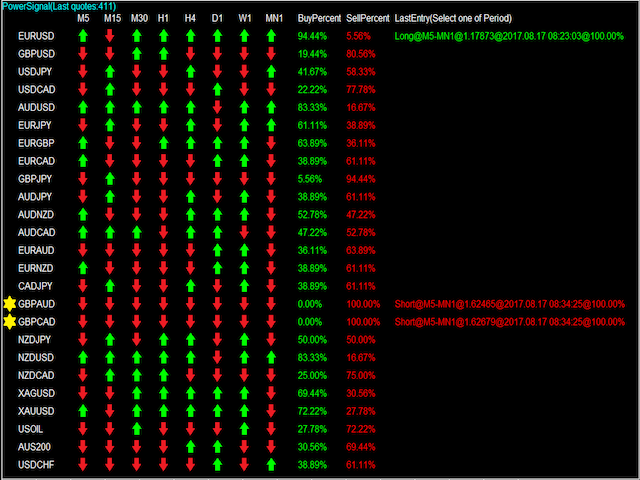
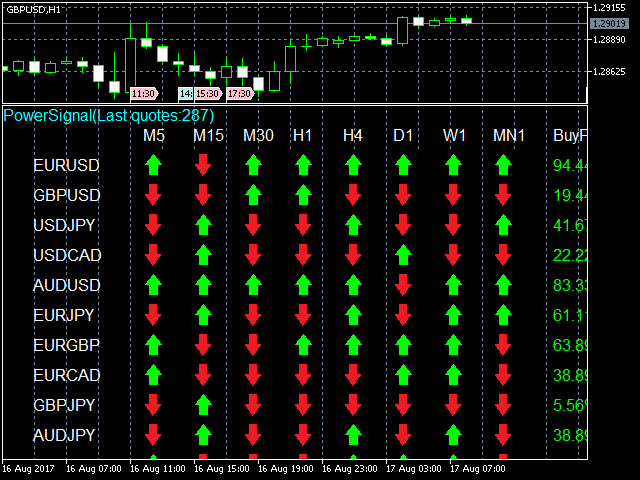
PowerSignal es un completo sistema de trading basado en el indicador técnico ATR. Este indicador registrará el estado actual de cada POWERTREND en cada marco temporal y par de divisas analizados. PowerSignal crea una lista de señales de fuerza de tendencia y punto de entrada evaluando estos datos. Si se produce una coincidencia total en cualquier par, aparecerá una alerta indicando dicho caso. Los datos de la lista incluyen Symbol, M5-MN1, BuyPercent, SellPercent, LastEntry. El LastEntry muestra los puntos de entrada (periodos, precio, tiempo). Cuando la intensidad de la tendencia es superior al 75%, se considera que es un par de divisas fuerte.
Entradas Valor
- Periodos = 14 - Periodo del indicador.
- Color del texto = Blanco - Color normal del texto.
- Buy Signal color = LawnGreen - Color de señal larga.
- Vender color de la señal = NaranjaRojo - Corto color de la señal.
- Alert_ON = false - Desactiva la Alarma. true - Activa la Alarma: soporta Alerta, Email, push.
- Alert_Min_Interval = 15
- Entry_Percent = PERCENT_100 - Requisitos de porcentaje de tendencia PERCENT_100 o más.
- Wait_Mins_For_Next_Signal = 30 - Esperar a la próxima vez de la señal.
Autor
- Daying Cao, un ingeniero de software con experiencia.