Returns MT5
- Indicadores
-
Fabrizio Malavasi
 ========================================================================================
 - Versión: 1.4
- Actualizado: 3 marzo 2021
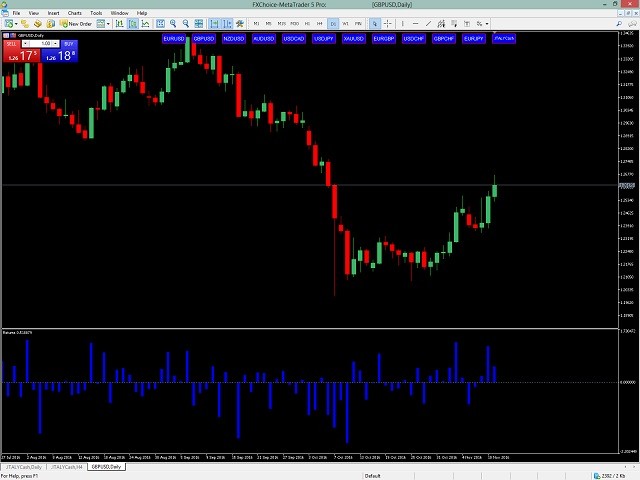
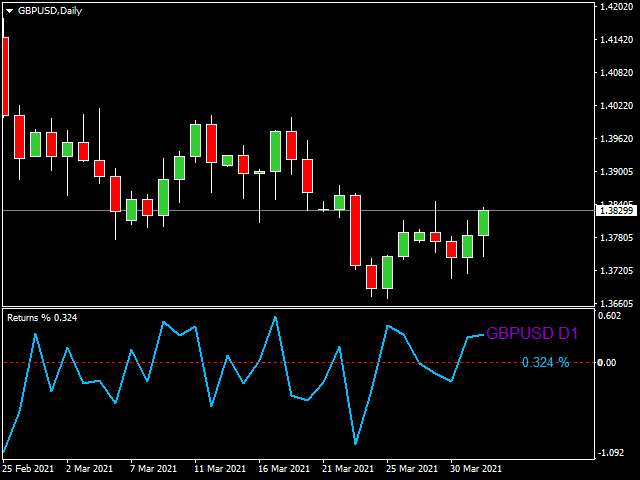
Este indicador muestra el valor de los rendimientos en el marco temporal seleccionado
They are calculated as logarithm of returns, rather than price or raw returns. For small returns, arithmetic and logarithmic returns will be similar. The benefit of using returns, versus prices, is normalization.
Es posible medir todas las variables en una métrica comparable a pesar de proceder de series de precios de valores desiguales
Entradas
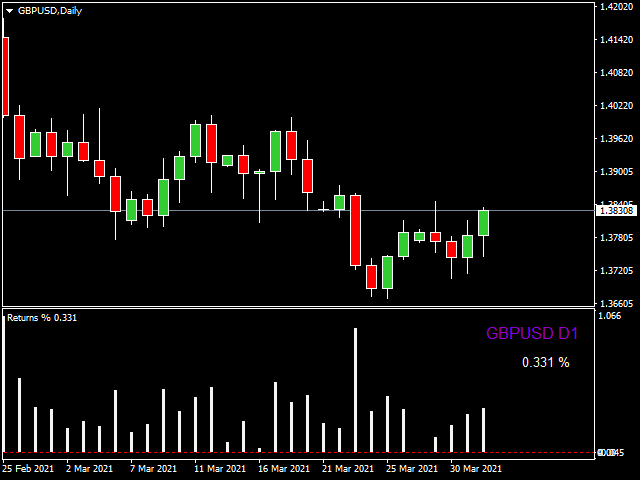
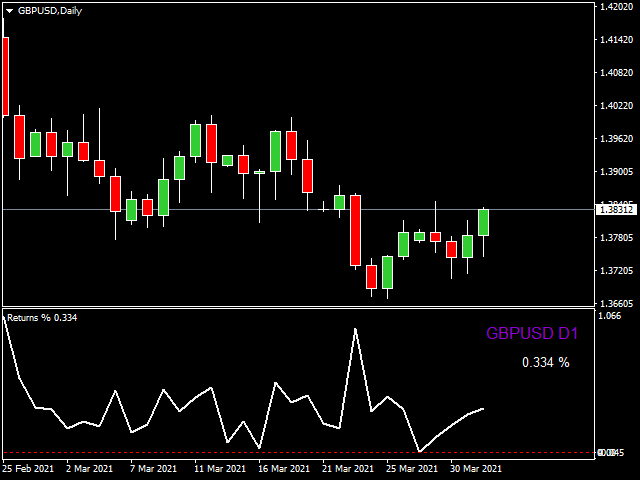
- Puede mostrar los datos tanto en forma de Histograma como de Línea
- También es posible mostrar el valor absoluto de los rendimientos

El usuario no ha dejado ningún comentario para su valoración