Trading Machine Tool
- Indicadores
- Fudheni Petrus Nambambi
- Versión: 3.30
- Activaciones: 17
TRADING MACHINE TOOL v3.3 - USER GUIDE
Professional SMC + Volume Profile Fusion Indicator for GOLD (XAUUSD)
Overview
Trading Machine Tool is a professional-grade indicator that fuses Smart Money Concepts (SMC) Order Blocks with Volume Profile analysis to deliver high-probability trading signals for GOLD (XAUUSD). The indicator automatically calculates a 7-factor probability score and displays clear, color-coded Order Blocks with entry signals.
Recommended Configuration
| Parameter | Specification |
|----------- |--------------- |
|Timeframe: M15, M30, H1, H4, D1, W1, MN1 (15 minutes or higher) |
|Trading Symbol: XAUUSD (GOLD) |
|Input Settings: Use DEFAULT values - No modification required |
| > ⚠️ Important: The indicator will NOT function on timeframes below M1 5. An error message will appear on chart if used on lower timeframes. |
|---|
Understanding Order Blocks
| Block Type | Color | Description |
|------------ |------- |------------- |
| BUY Order Block: 🟡 Yellow (filled) | Institutional accumulation zone - Look for BUY opportunities |
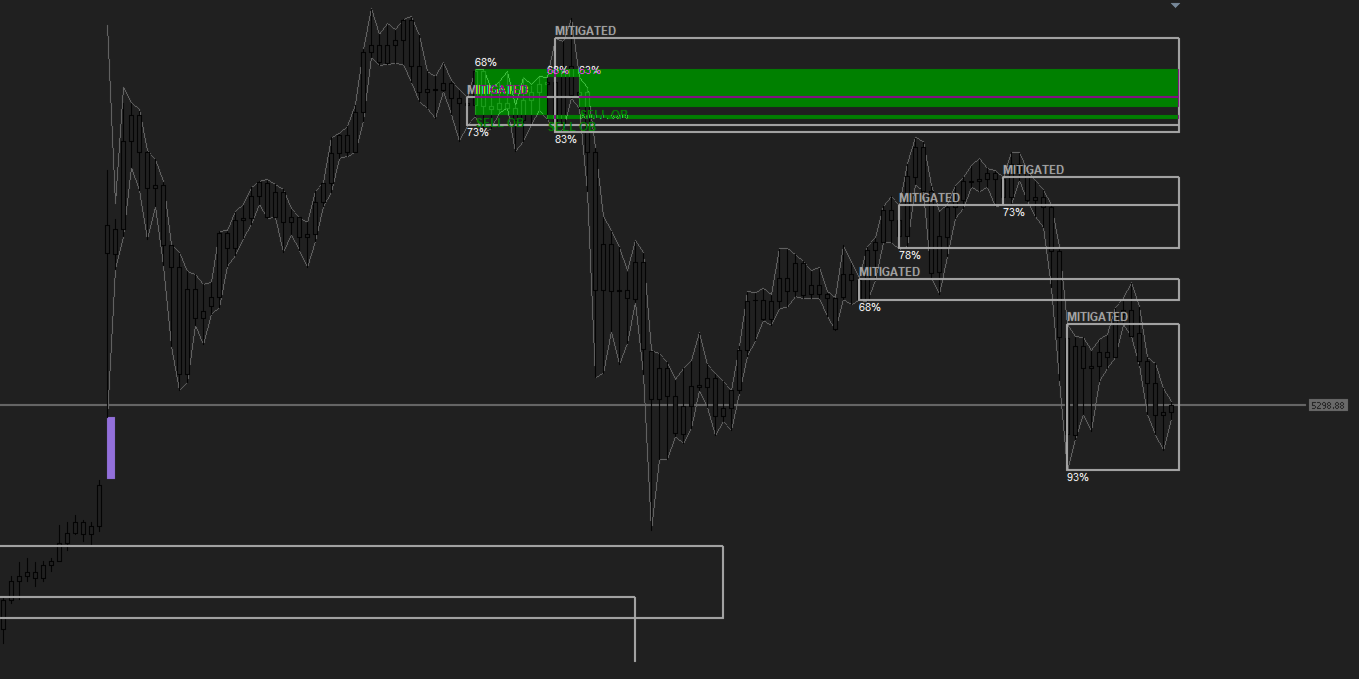
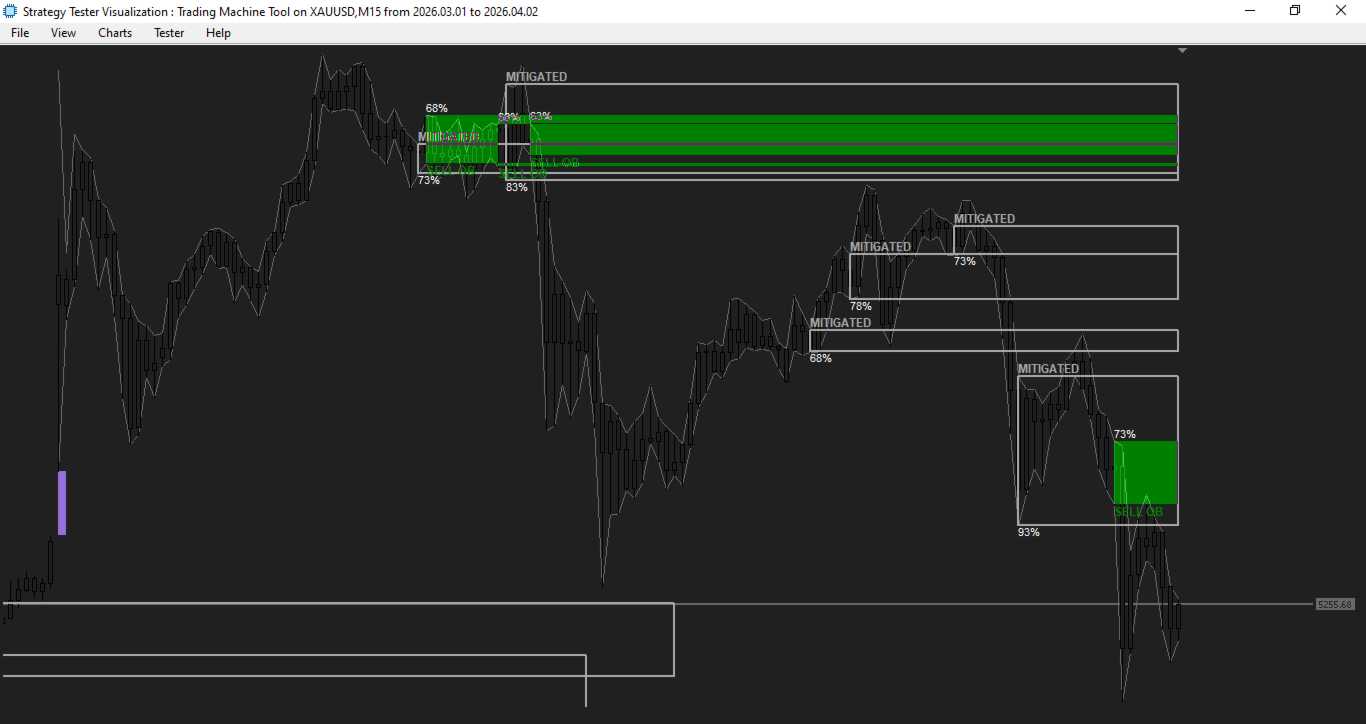
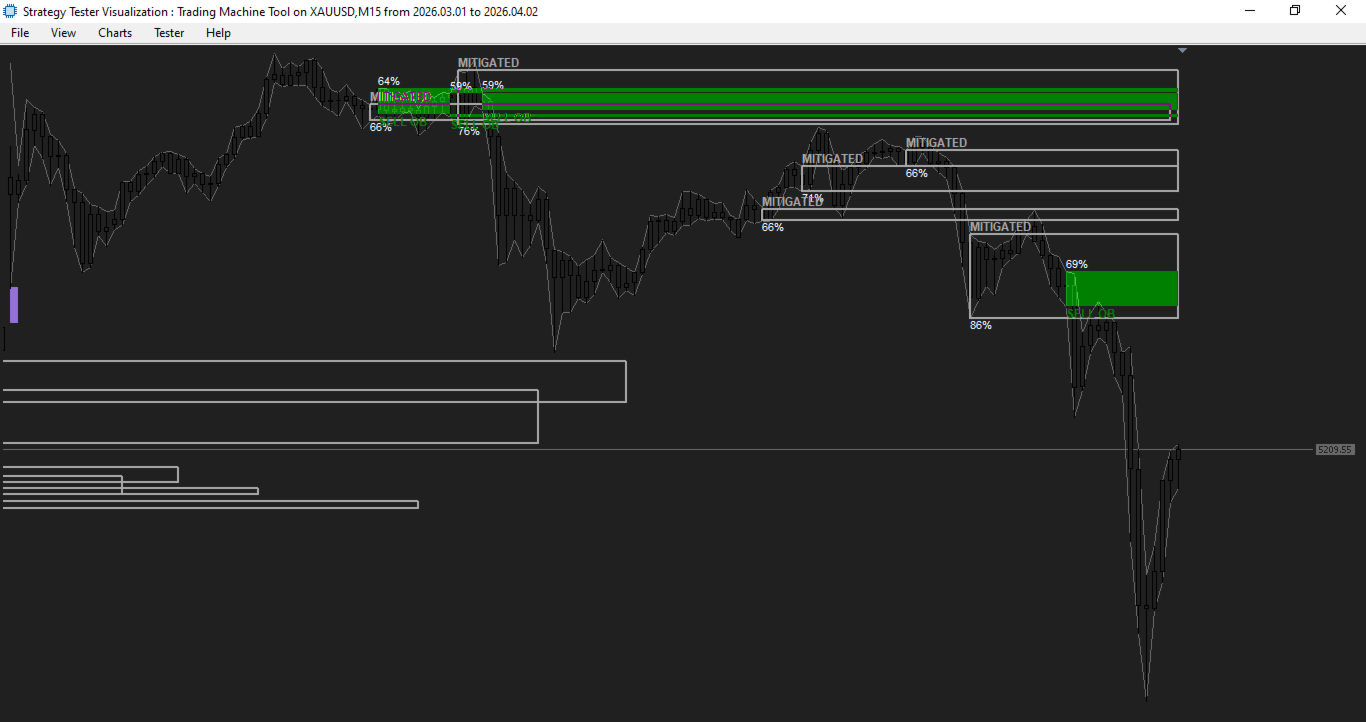
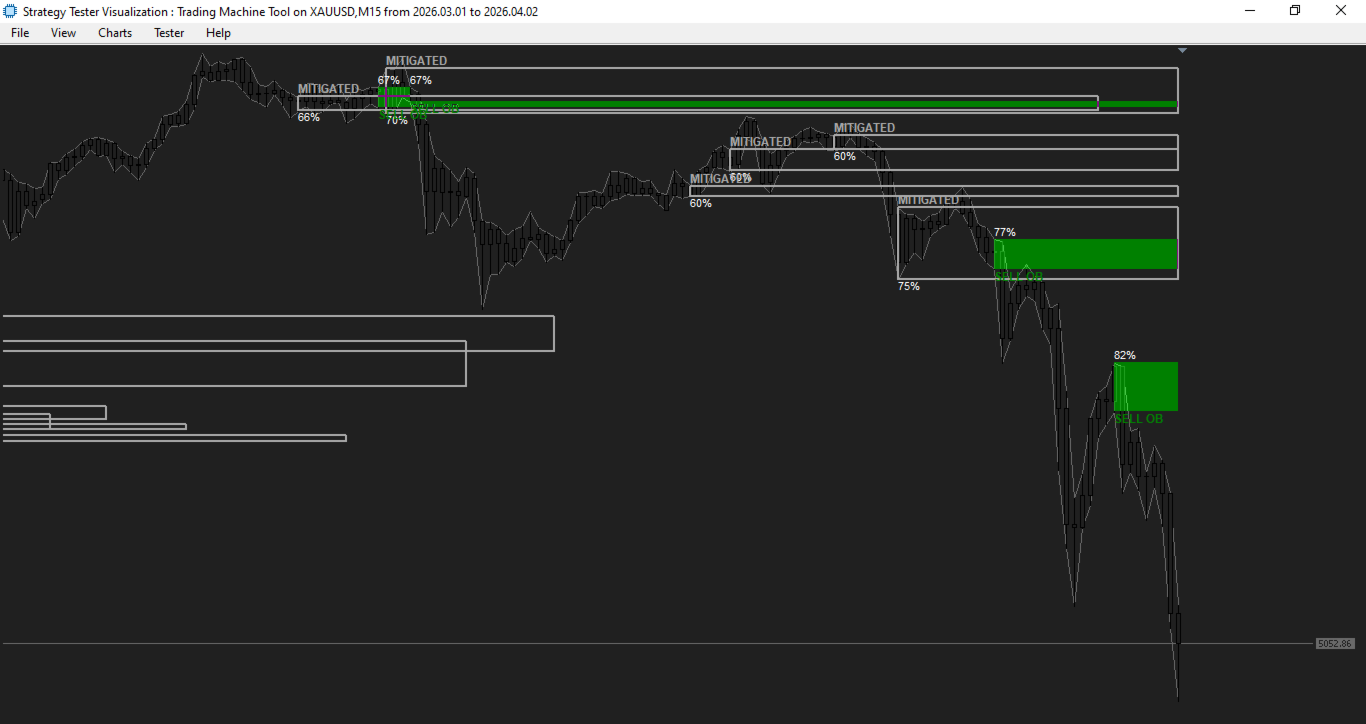
| SELL Order Block: 🟢 Green (filled) | Institutional distribution zone - Look for SELL opportunities |
Each Order Block displays:
- Probability Percentage (e.g., "75%") - Calculated confidence level
- FVG" label - Fair Value Gap present (adds confluence)
- BUY OB" or "SELL OB" - Clear direction identification
Signal Probability Classification
| Probability Range | Classification | Description |
|---|---|---|
| 80% - 98% | ★ STRONG SIGNAL ★ | Highest confidence - Priority trades |
| 65% - 79% | ● CONFLUENCE ● | Valid setups with good probability |
| Below 65% | Filtered Out | Not displayed - Avoid trading |
| How to Trade - Step by Step |
|---|
Step 1: Identify Order Block Direction
-Yellow block on chart → Prepare for BUY signals only
-Green block on chart → Prepare for SELL signals only
Step 2: Wait for Price Entry
- Price must enter the colored Order Block zone
- The indicator automatically detects when price enters the block
Step 3: Signal Generation (Automatic)
When price enters the block AND a confirming candlestick pattern appears:
- LIME Green Up Arrow → BUY signal triggered
- 🔴 Red Down Arrow** → SELL signal triggered
The arrow displays the probability percentage (e.g., "[87% STRONG]")
Step 4: Execute Trade
| Signal | Entry | Stop Loss | Take Profit |
|---|
| BUY: Market price at LIME arrow | Below Yellow Order Block low | 2x to 3x Risk-to-Reward |
| SELL: Market price at RED arrow | Above Green Order Block high | 2x to 3x Risk-to-Reward |
Exit Strategy
| Exit Condition | Trigger | Action |
|---|
| Profit Target: Price reaches 1:2 or 1:3 R:R | Close position immediately |
| Stop Loss: Price breaks opposite side of Order Block | Close position - signal invalid |
| Signal Expiry: 5 minutes after signal appears | Signal auto-deletes - monitor closely |
| Block Mitigation: Order Block turns DARK GRAY | EXIT IMMEDIATELY - structure failed |
Critical Trading Rules
1. Never trade against Order Block direction
- Yellow block = BUY only
- Green block = SELL only
2. Respect probability thresholds
- Only trade signals with 65%+ probability (automatically filtered)
3. Signal lifetime is 5 minutes
- Each signal auto-deletes after 5 minutes
- If no entry within 5 minutes, wait for new signal
4. Mitigated blocks turn dark gray
- Order Block has been violated by price
- Close any open positions related to that block
5. Minimum timeframe requirement
- Indicator only functions on M15 and above
- Lower timeframes produce unreliable signals
Visual Indicators Meaning
| Yellow filled rectangle | Active BUY Order Block |
| Green filled rectangle | Active SELL Order Block |
| ⚫ Dark gray rectangle | Mitigated Order Block (INACTIVE) |
| LIME Up Arrow | BUY signal with probability |
| 🔴 Red Down Arrow | SELL signal with probability |
| "[XX% STRONG]" | High confidence signal (80%+) |
| "[XX% CONF]" | Confluence signal (65-79%) |
| "FVG" label | Fair Value Gap present |
| #Perfect Trade Scenario |
|---|
Setup Detected:
1. Yellow BUY Order Block appears on H1 chart
2. Probability displayed: 87%
3. Price enters the yellow zone
4. LIME arrow appears with "[87% STRONG]"
Execution:
| Disclaimer |
|---|
| This indicator provides probability-based trading signals based on historical price and volume data. Trading financial instruments involves substantial risk of loss. Past performance does not guarantee future results. Always use proper risk management and never risk more than 1-2% of your account on a single trade. Support For questions, support, or suggestions, please contact the developer through the MQL5 platform. |