Trend Track
- Indicadores
- Versión: 1.0
- Activaciones: 5

Indicador TrendTrack : ¡Siga la tendencia fácilmente!
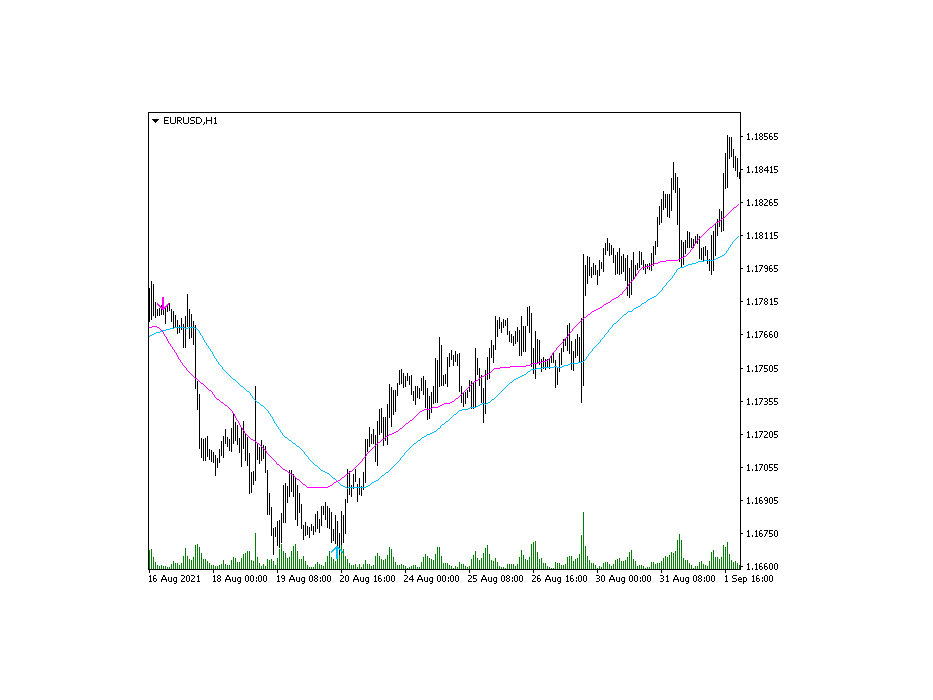
El indicador TrendTrack está diseñado para analizar el comportamiento de los precios en el mercado Forex, ayudando al operador a detectar rápidamente debilidades temporales o cambios evidentes en la dirección de la tendencia. Entrar en el mercado es sólo el primer paso, pero mantener una posición es más difícil. Con TrendTrack, ¡mantener la tendencia se convierte en algo fácil!
Peculiaridades:
Análisis de tendencias:
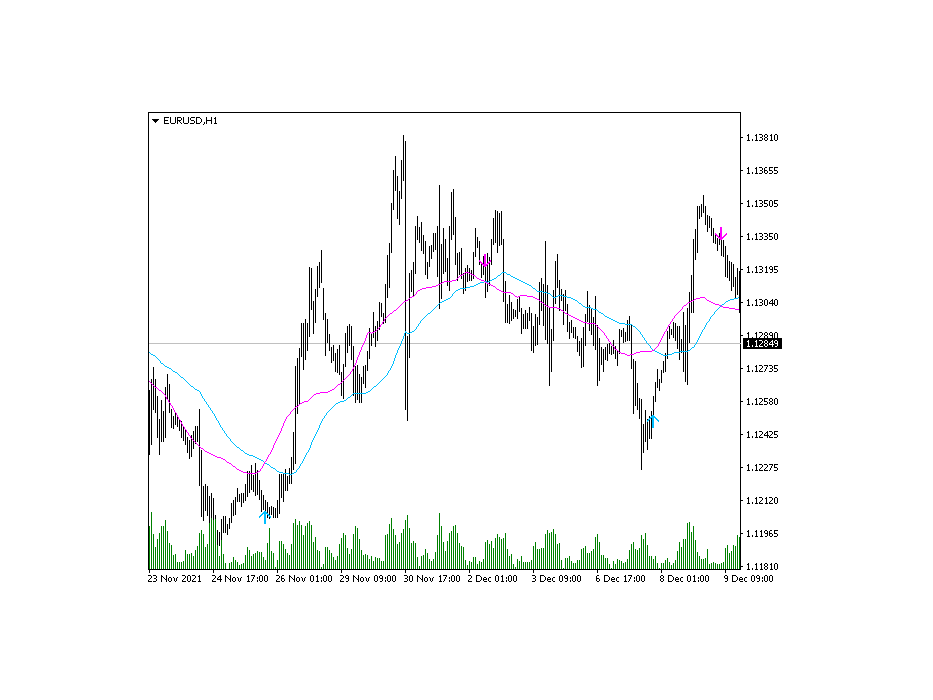
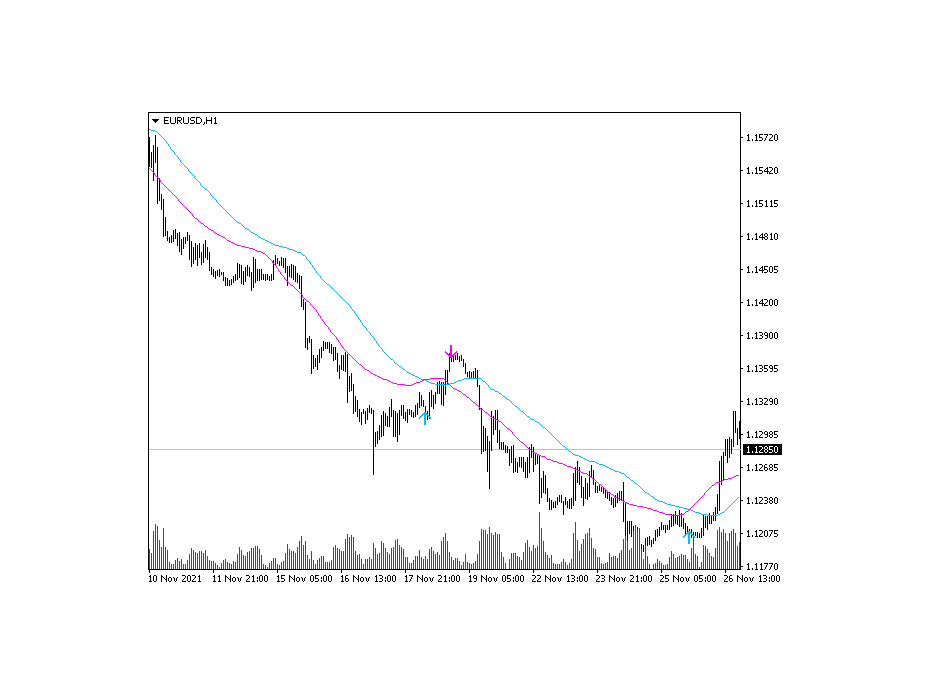
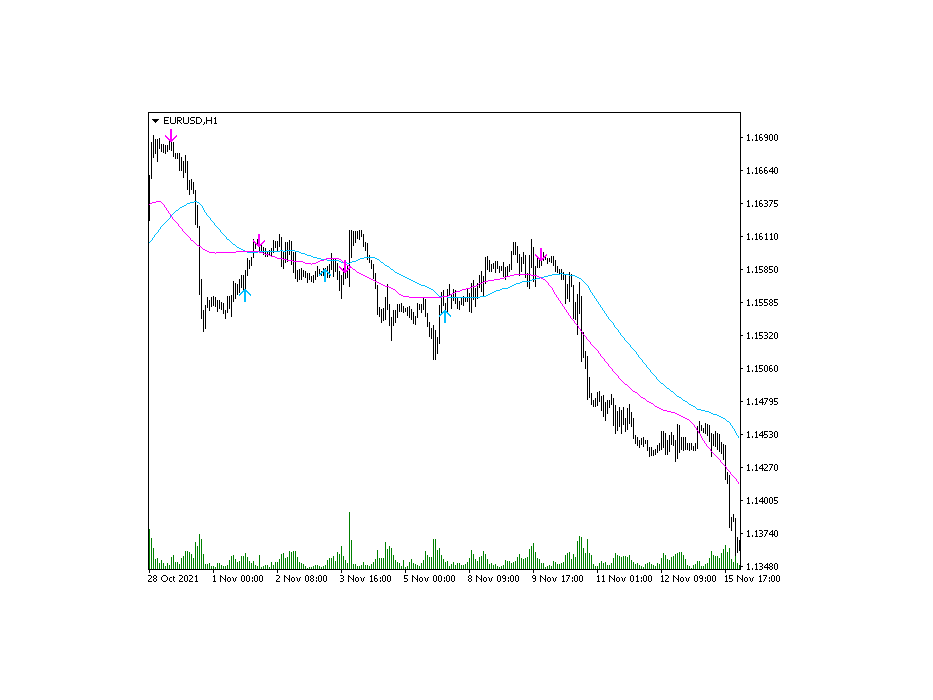
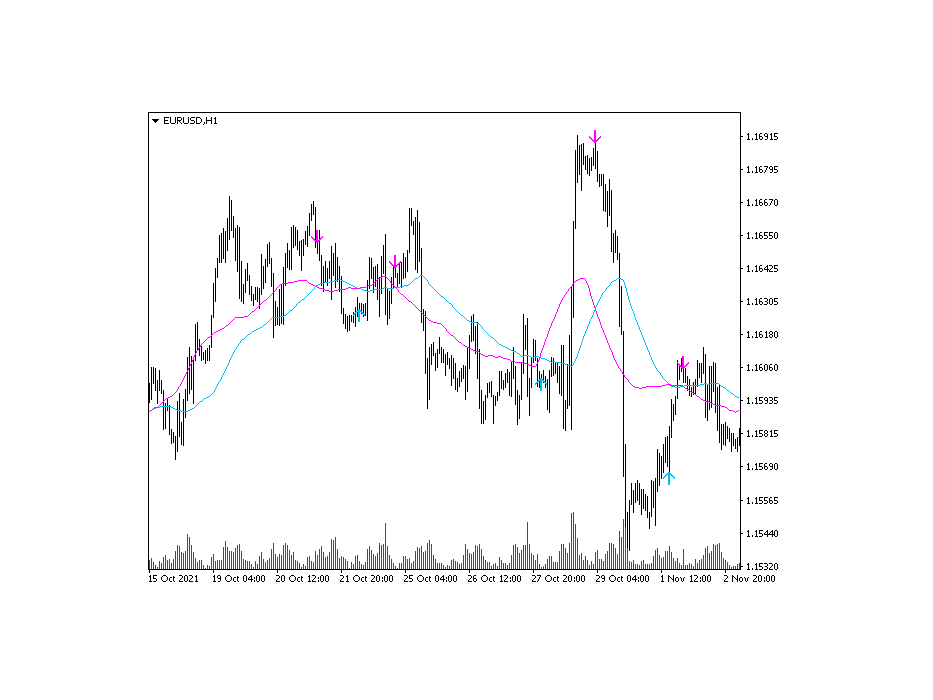
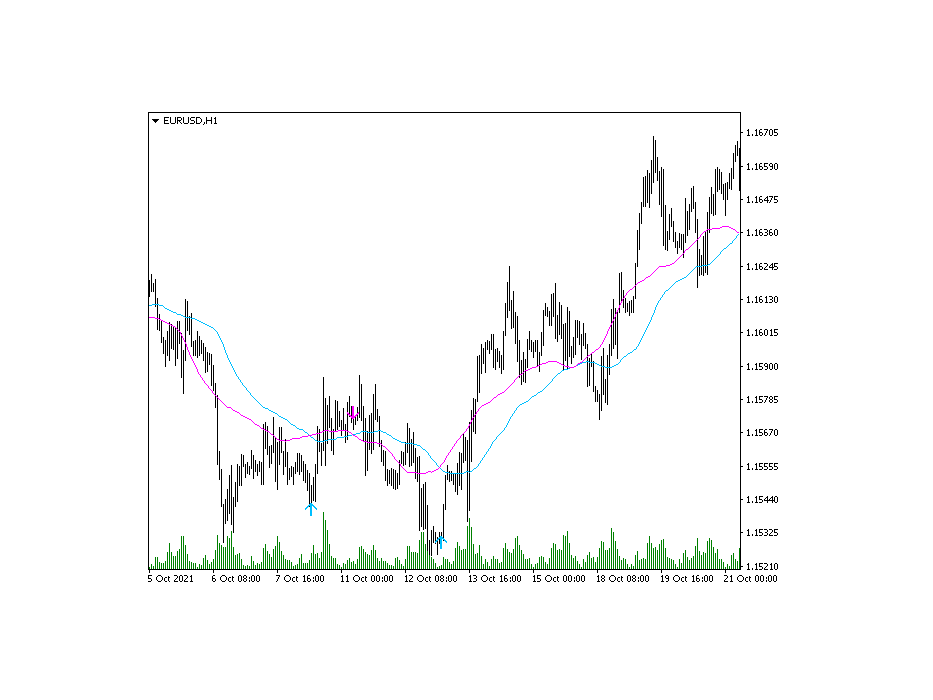
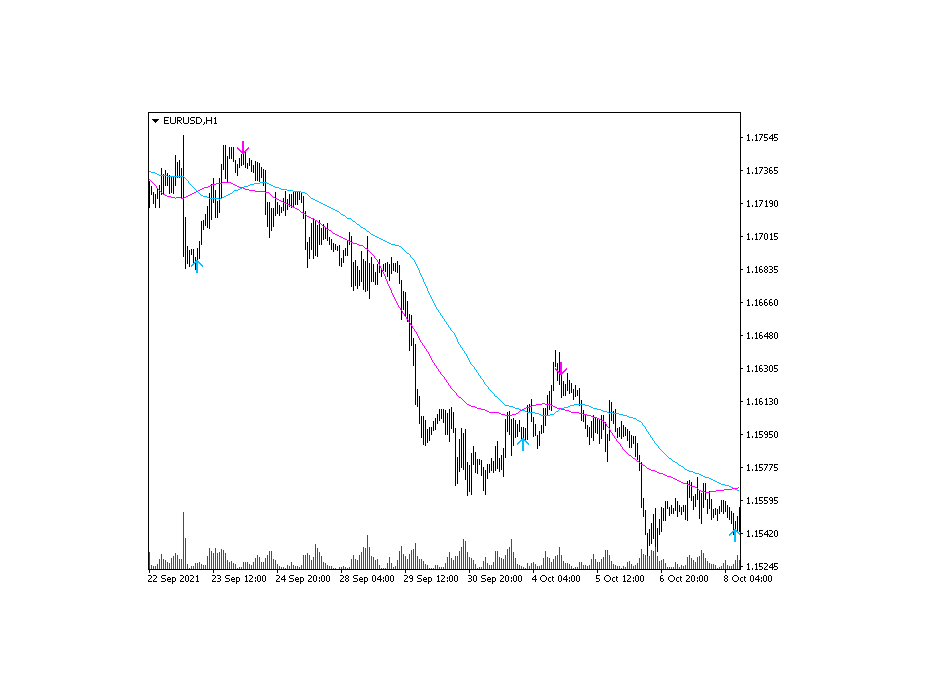
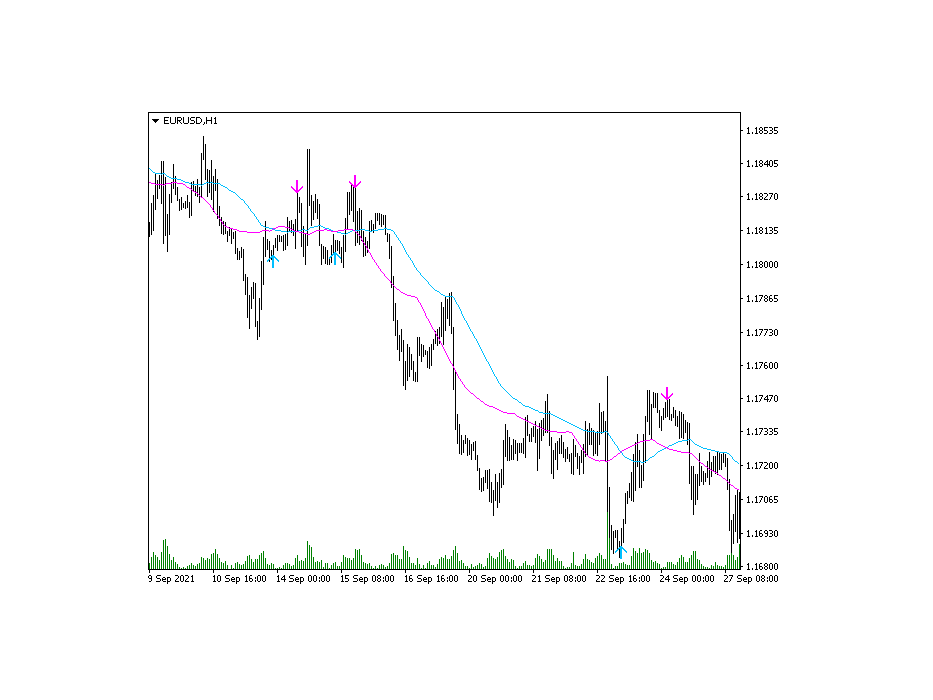
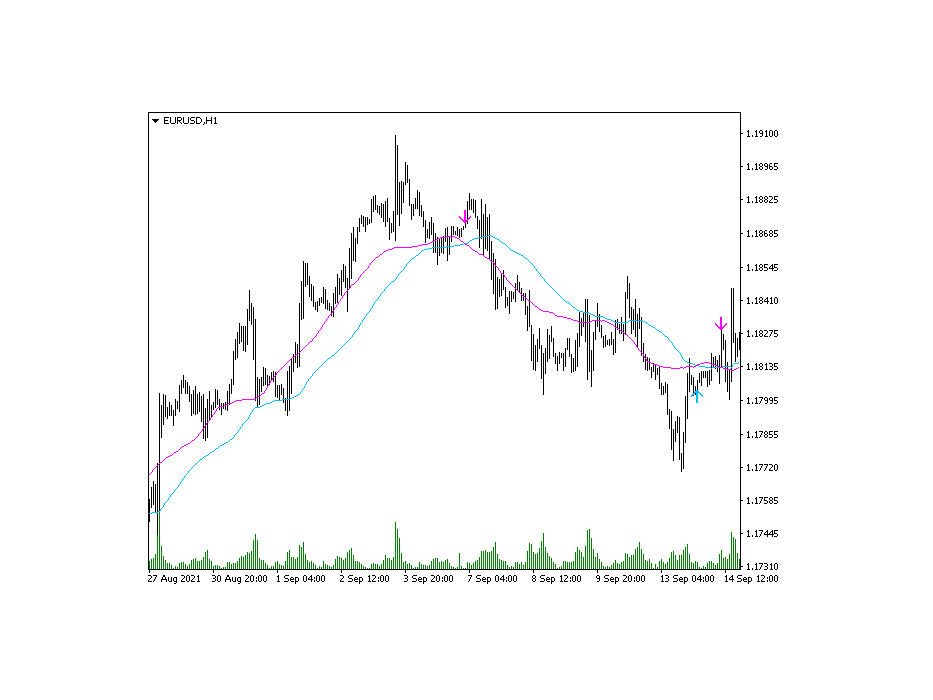
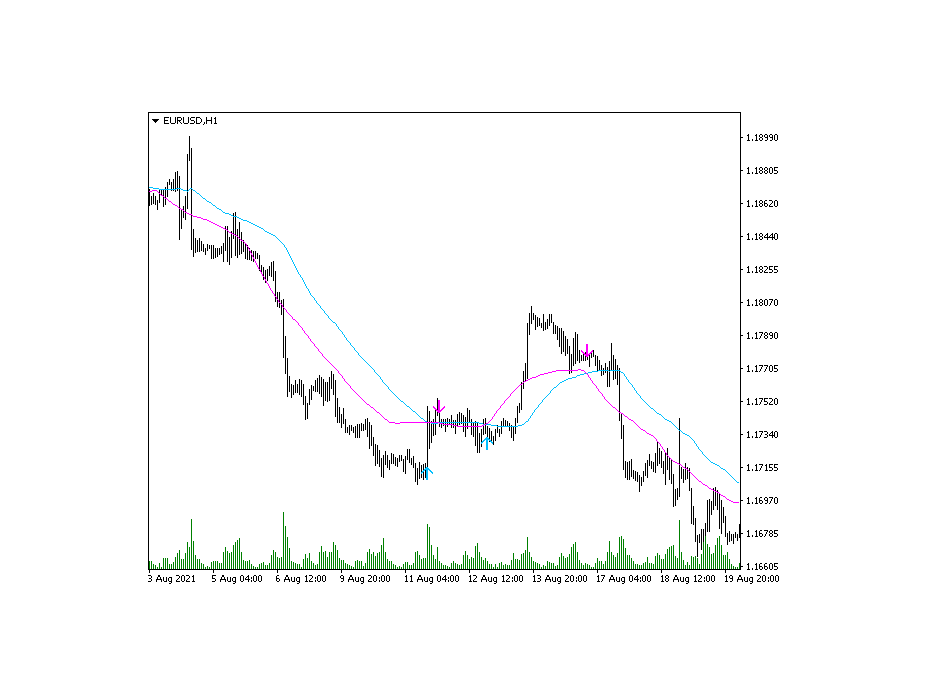
El indicador analiza datos históricos, proporcionando señales al operador.El formato de flecha del indicador le permite recibir instrucciones precisas con un error mínimo.
Facilidad de uso:
Para abrir una operación, basta con esperar a que aparezca la flecha en la dirección deseada.La operación se cierra cuando aparece una flecha en la dirección opuesta.
Fiabilidad de las señales:
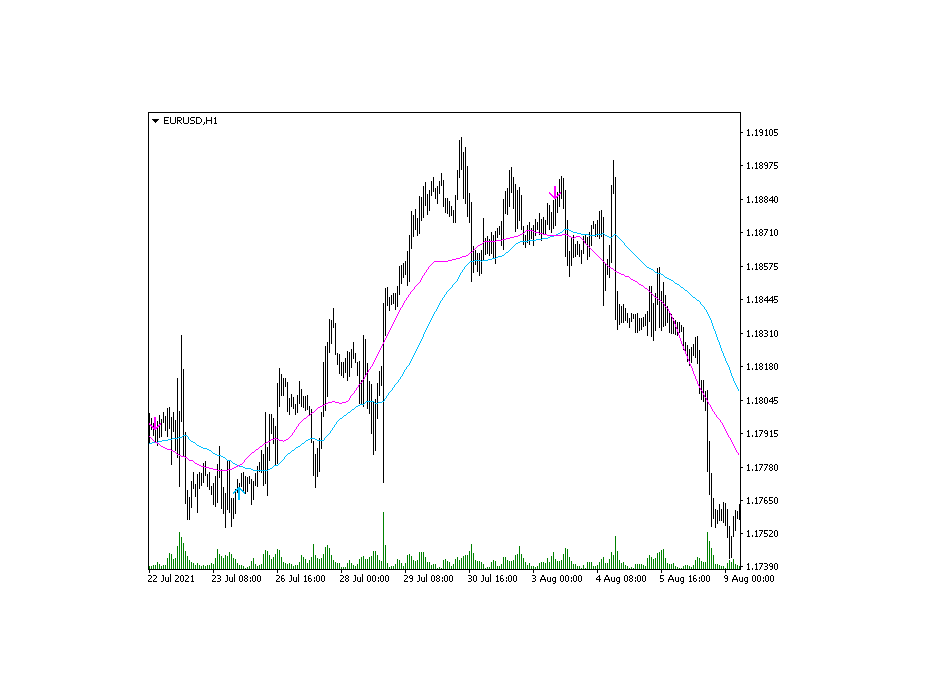
Las señales del indicador permanecen en el gráfico histórico, lo que permite evaluar su eficacia y estudiar los resultados anteriores.Operar con el indicador TrendTrack se vuelve más predecible y seguro.
Sistema de trading preparado:
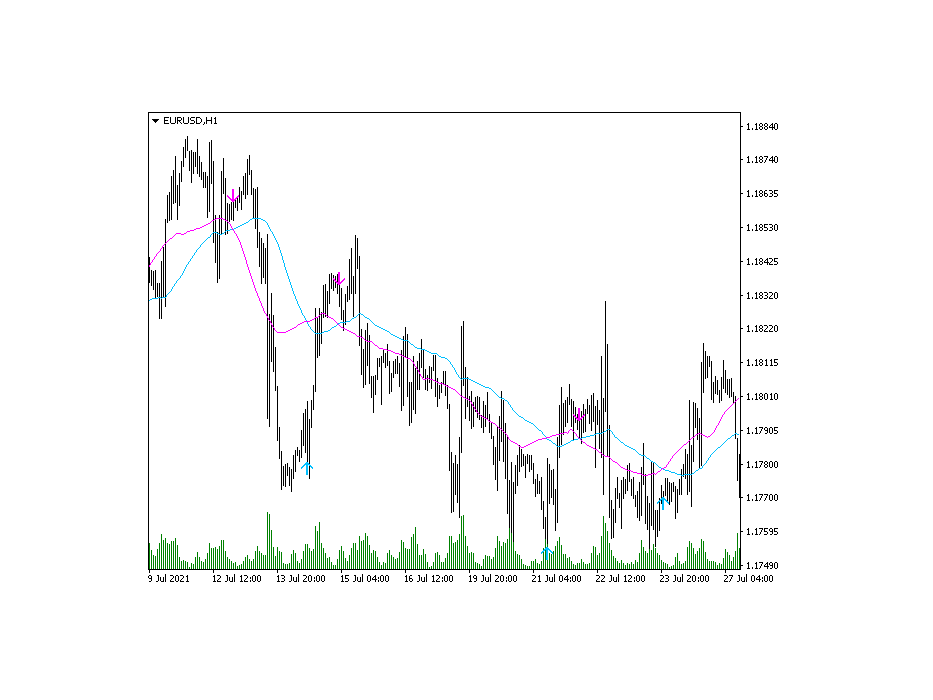
El indicador TrendTrack ofrece un sistema de trading listo para el trader. Sólo tiene que seguir las señales que proporciona y tomar decisiones sobre la entrada y salida de operaciones. Se trata de una herramienta que le ayuda a identificar los puntos de inflexión adecuados para un trading estable y exitoso.
Cómo utilizarlo:
- Espere a que la flecha del indicador aparezca en la dirección deseada.
- Abra una operación de acuerdo con la dirección de la flecha.
- Permanezca en la operación hasta que aparezca la flecha en la dirección opuesta.
- Cierre la operación y comprométase.
El indicador TrendTrack es su fiel ayudante en el mercado Forex. Fácil de usar y eficaz, le ayudará a mantenerse en la tendencia y a tomar las decisiones de trading correctas. ¡Obtenga este indicador ahora y mejore sus operaciones al siguiente nivel!