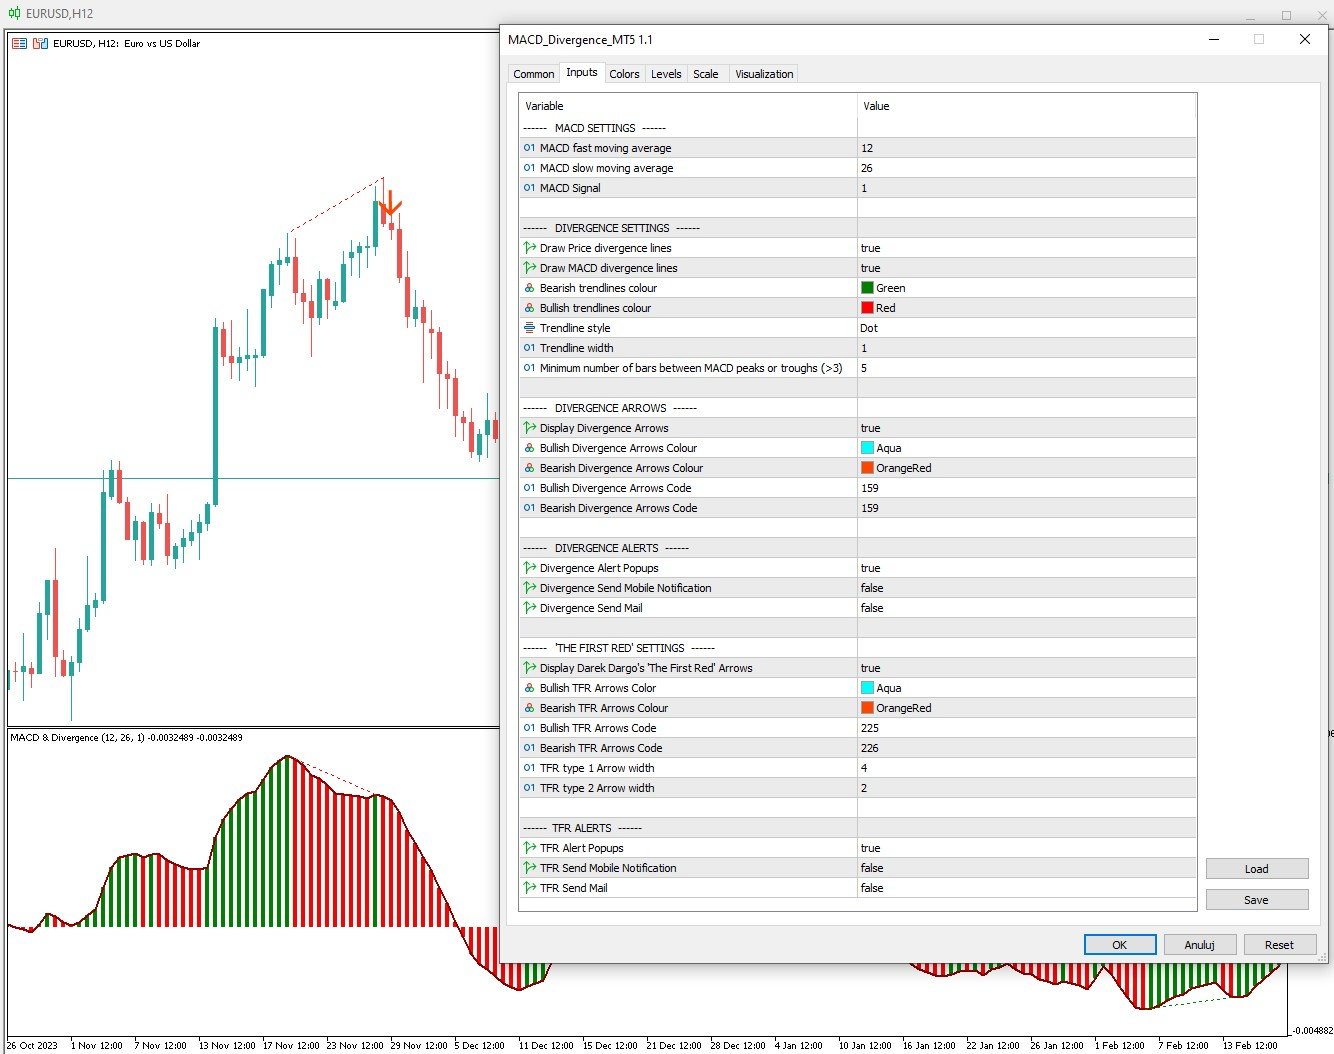
MACD Divergence and TFR for MT5
- Indicadores
- Versión: 1.1
- Actualizado: 2 abril 2024
- Activaciones: 5
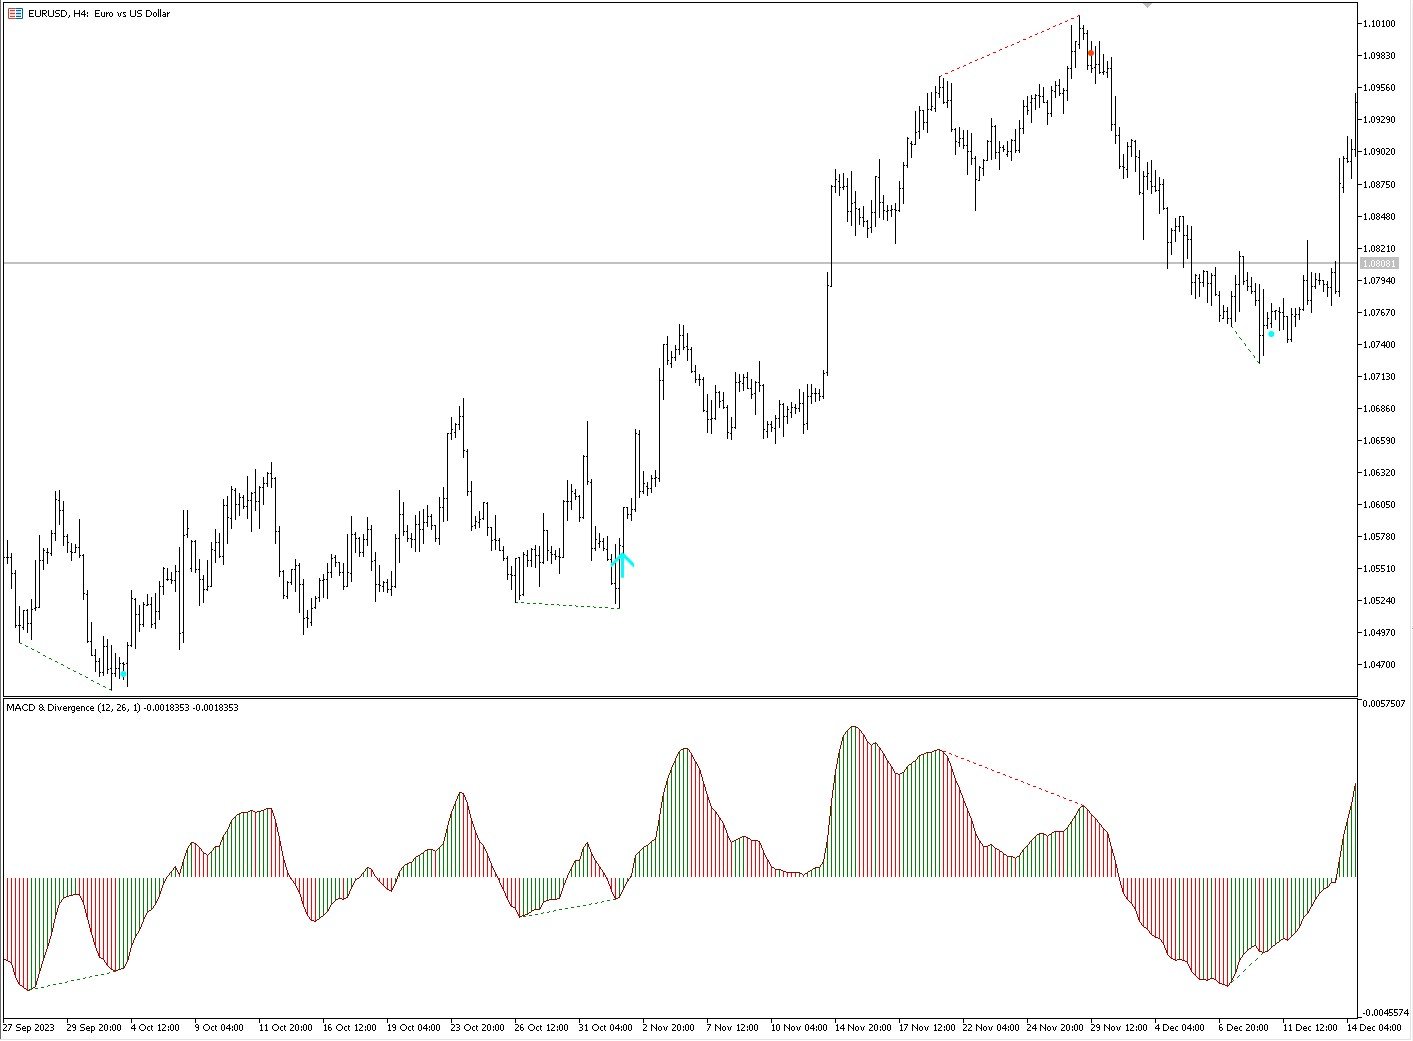
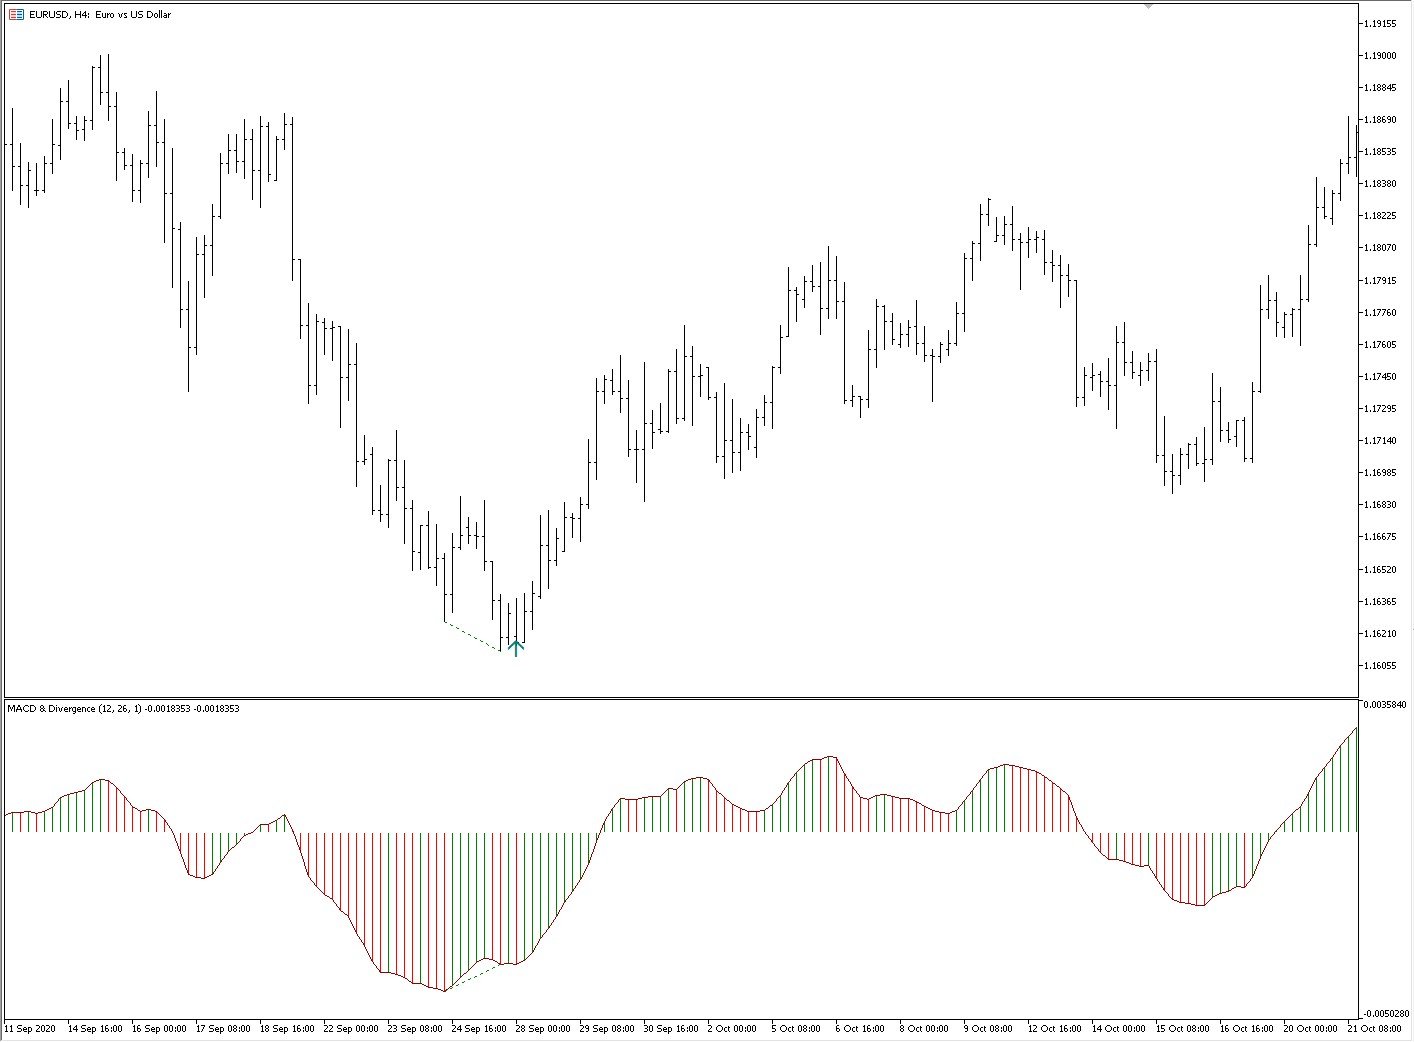
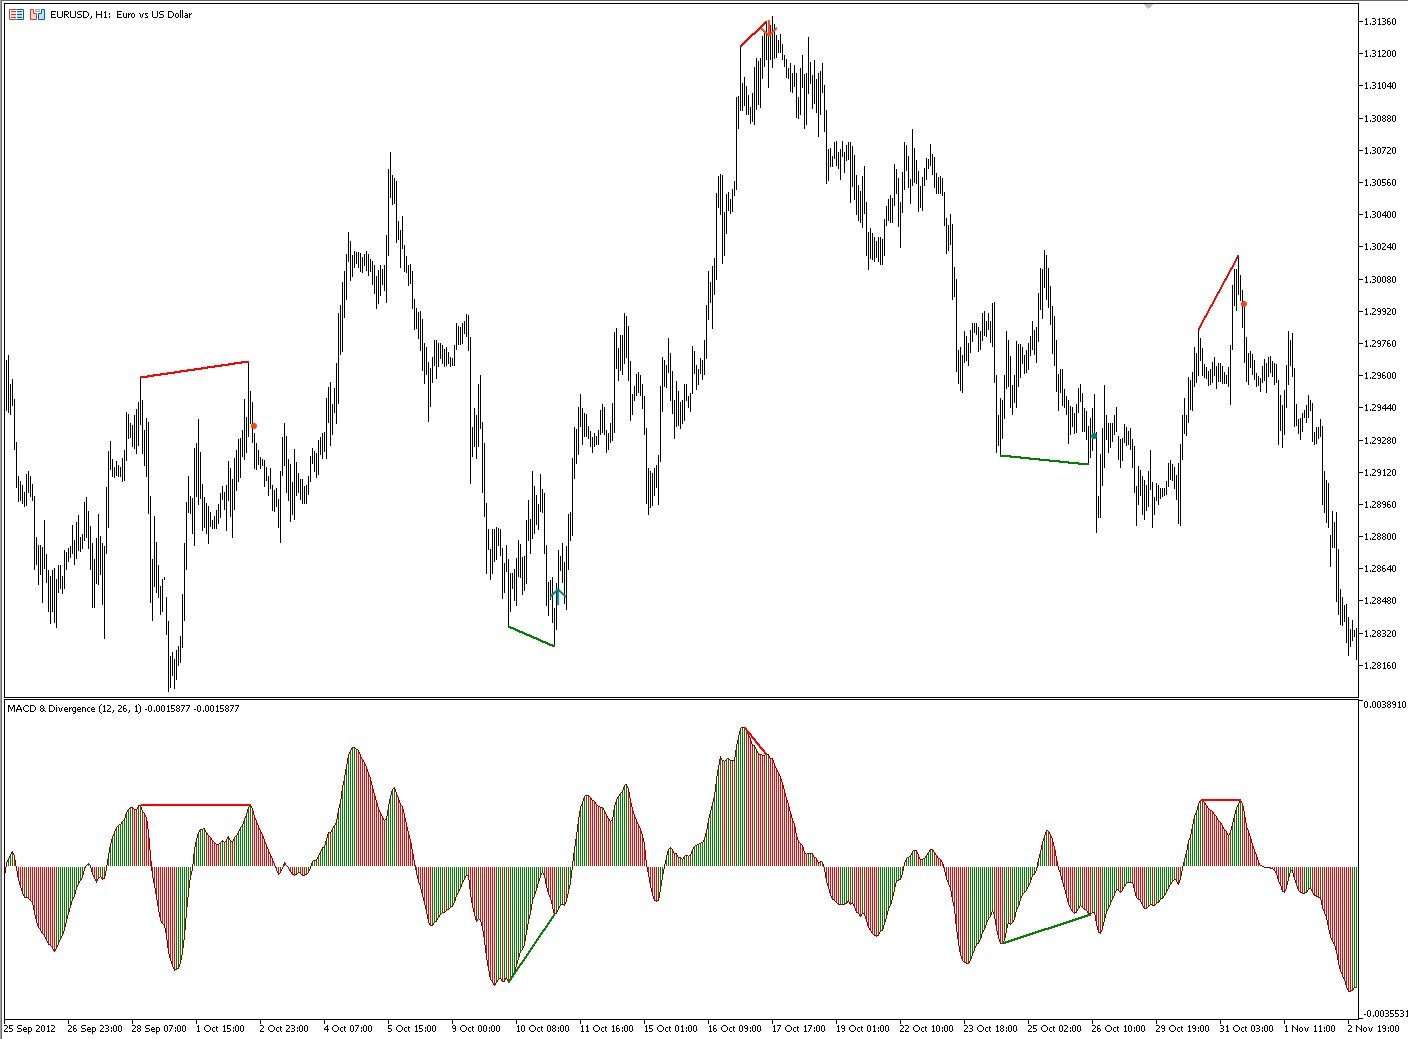
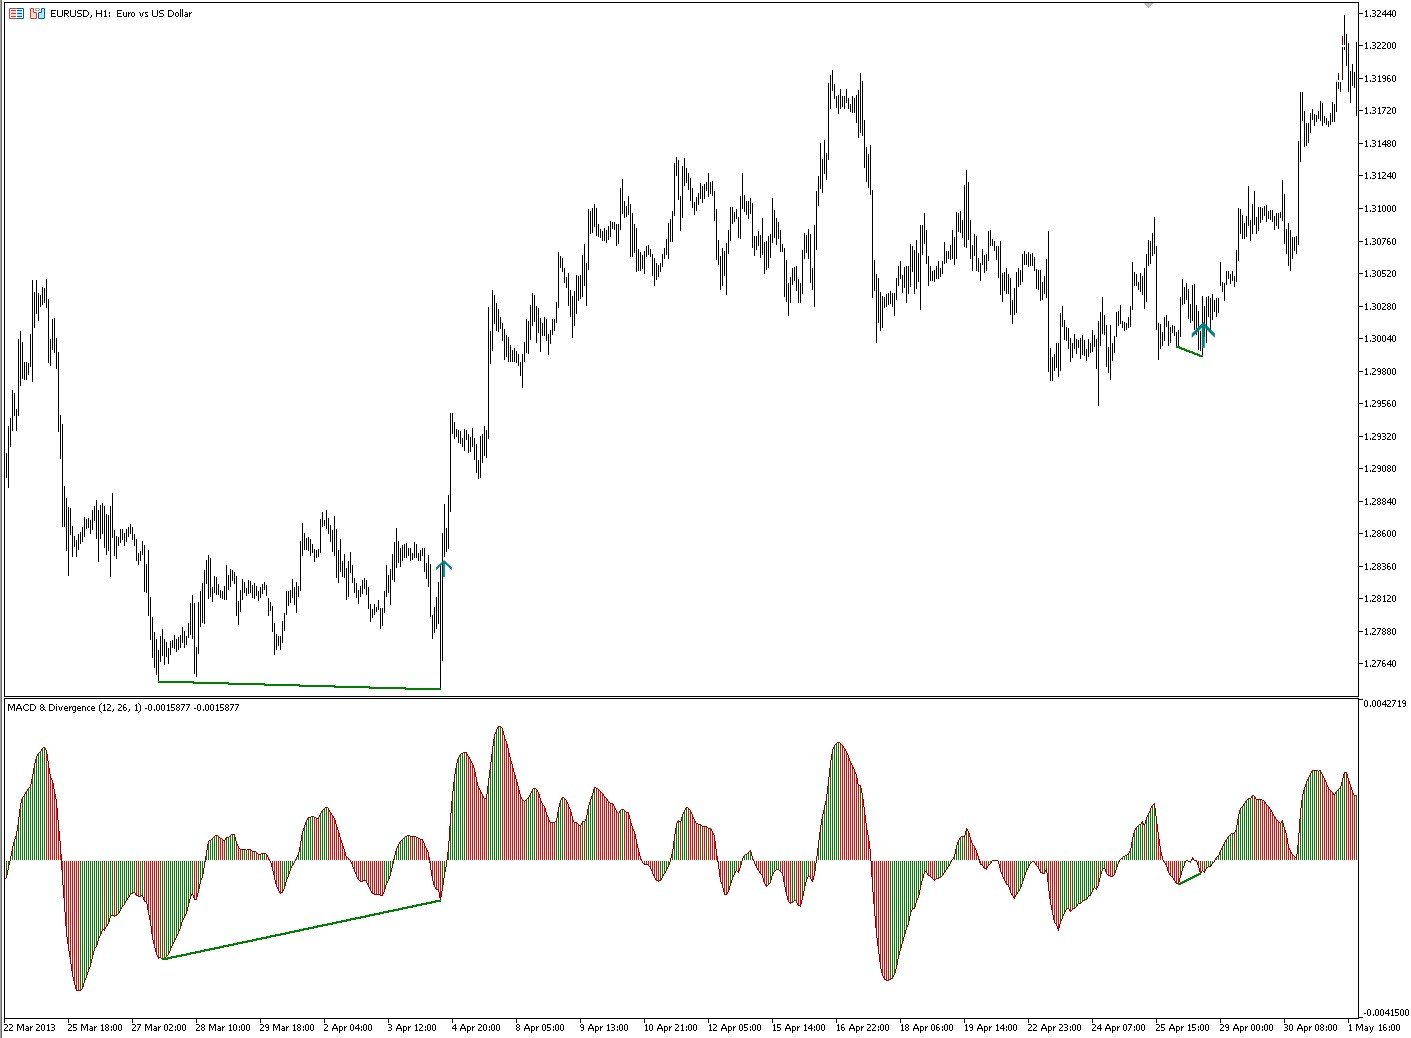
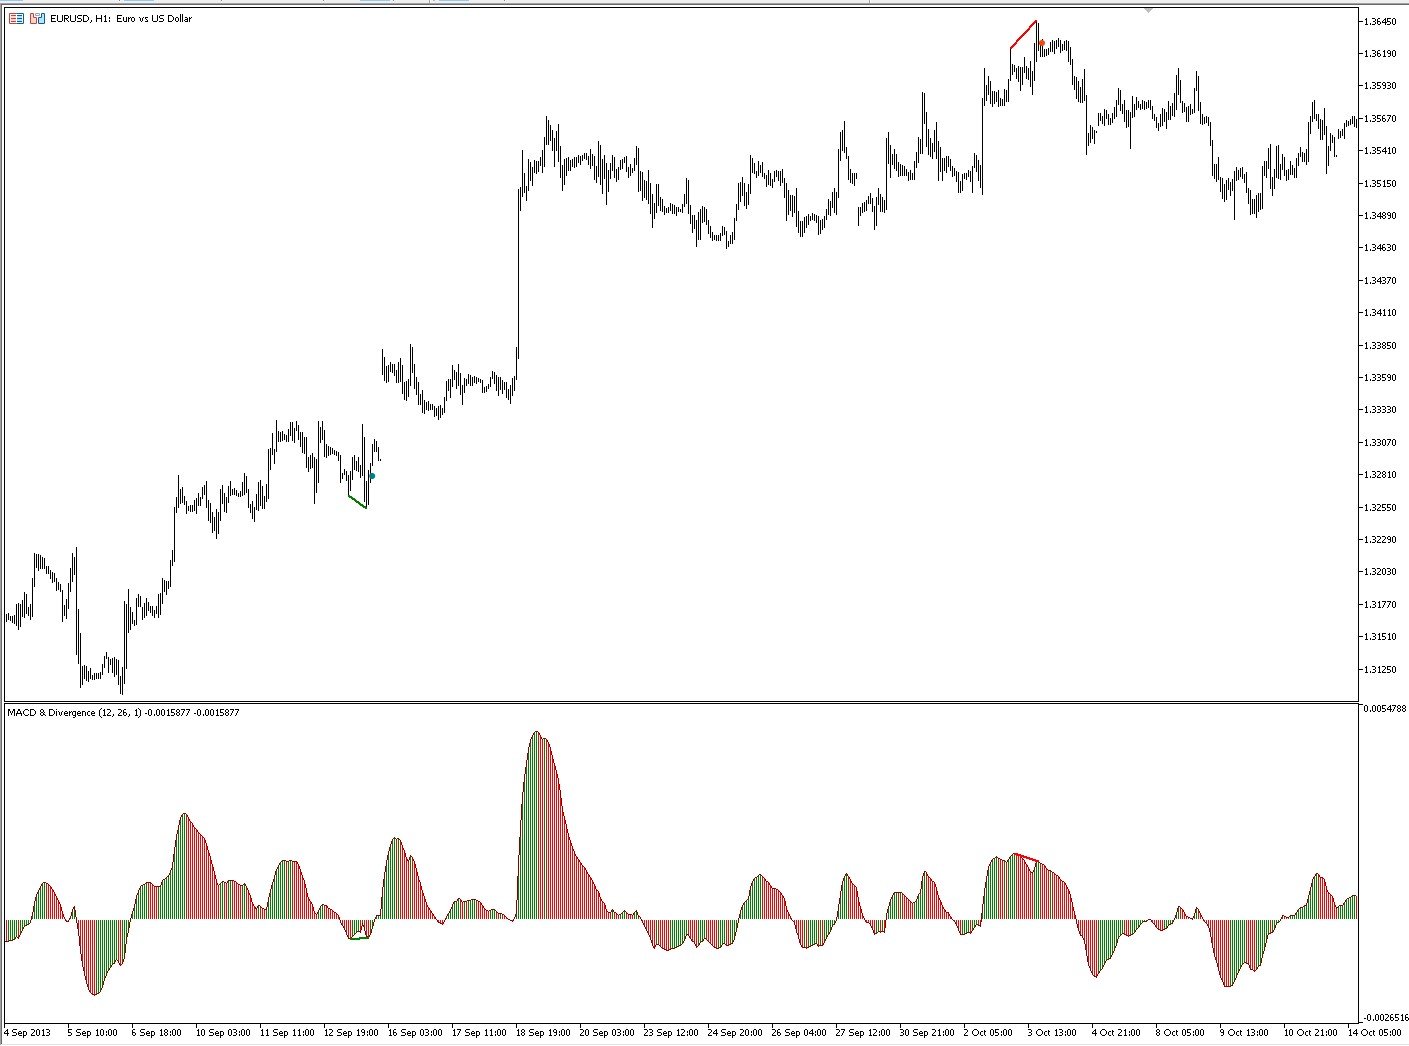
El indicador identifica la divergencia analizando las pendientes de las líneas que conectan los picos o valles del precio y del histograma MACD.
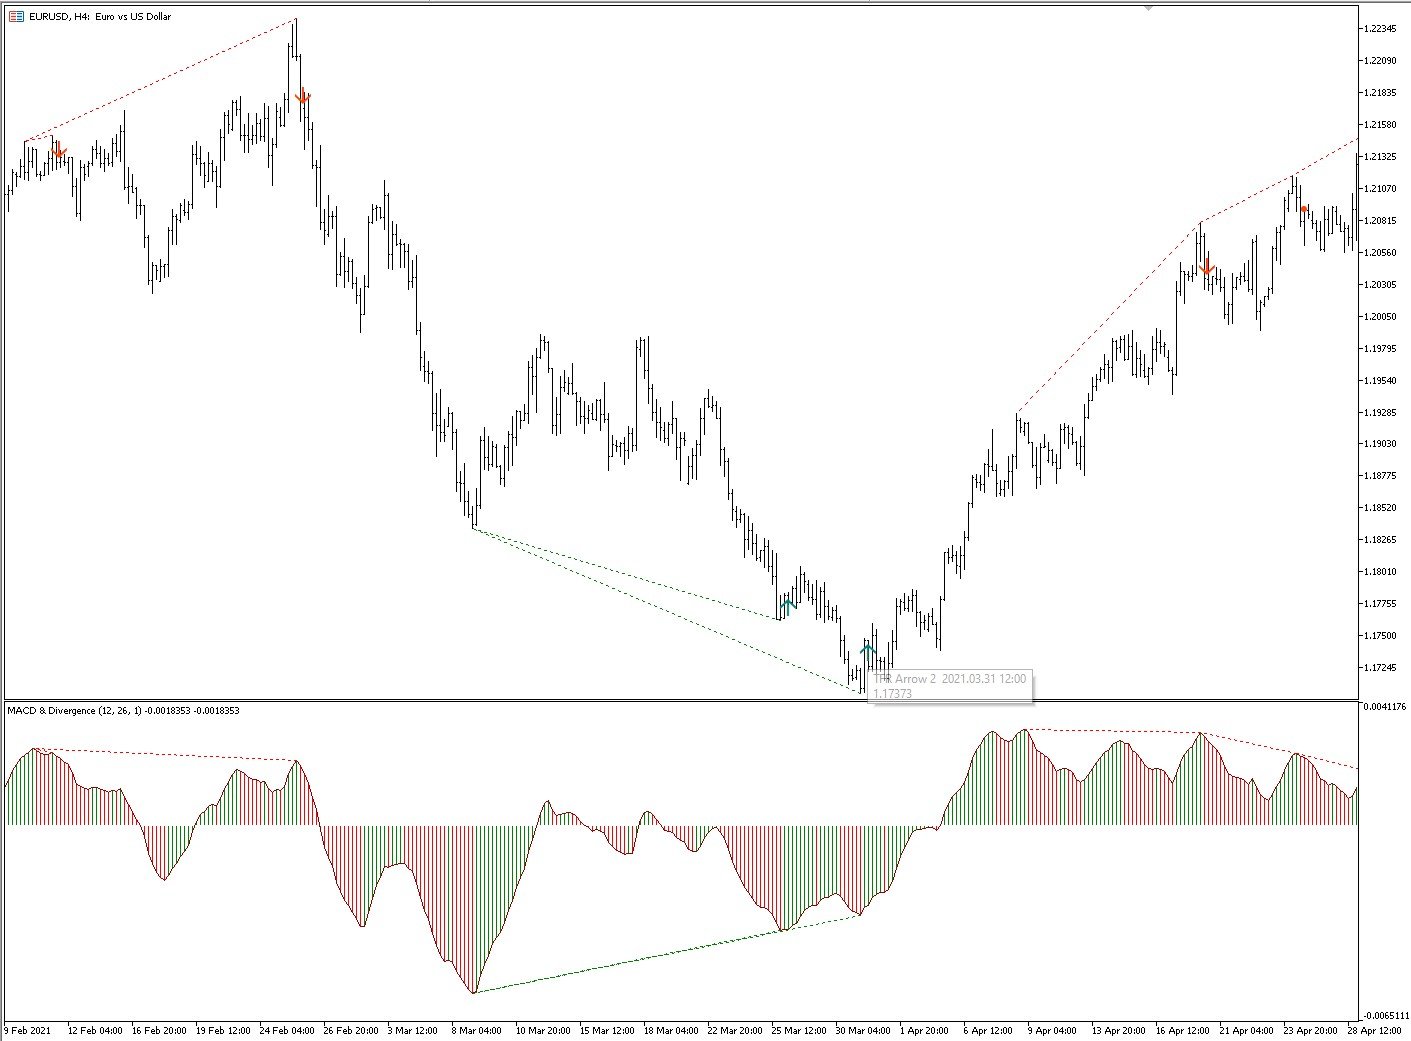
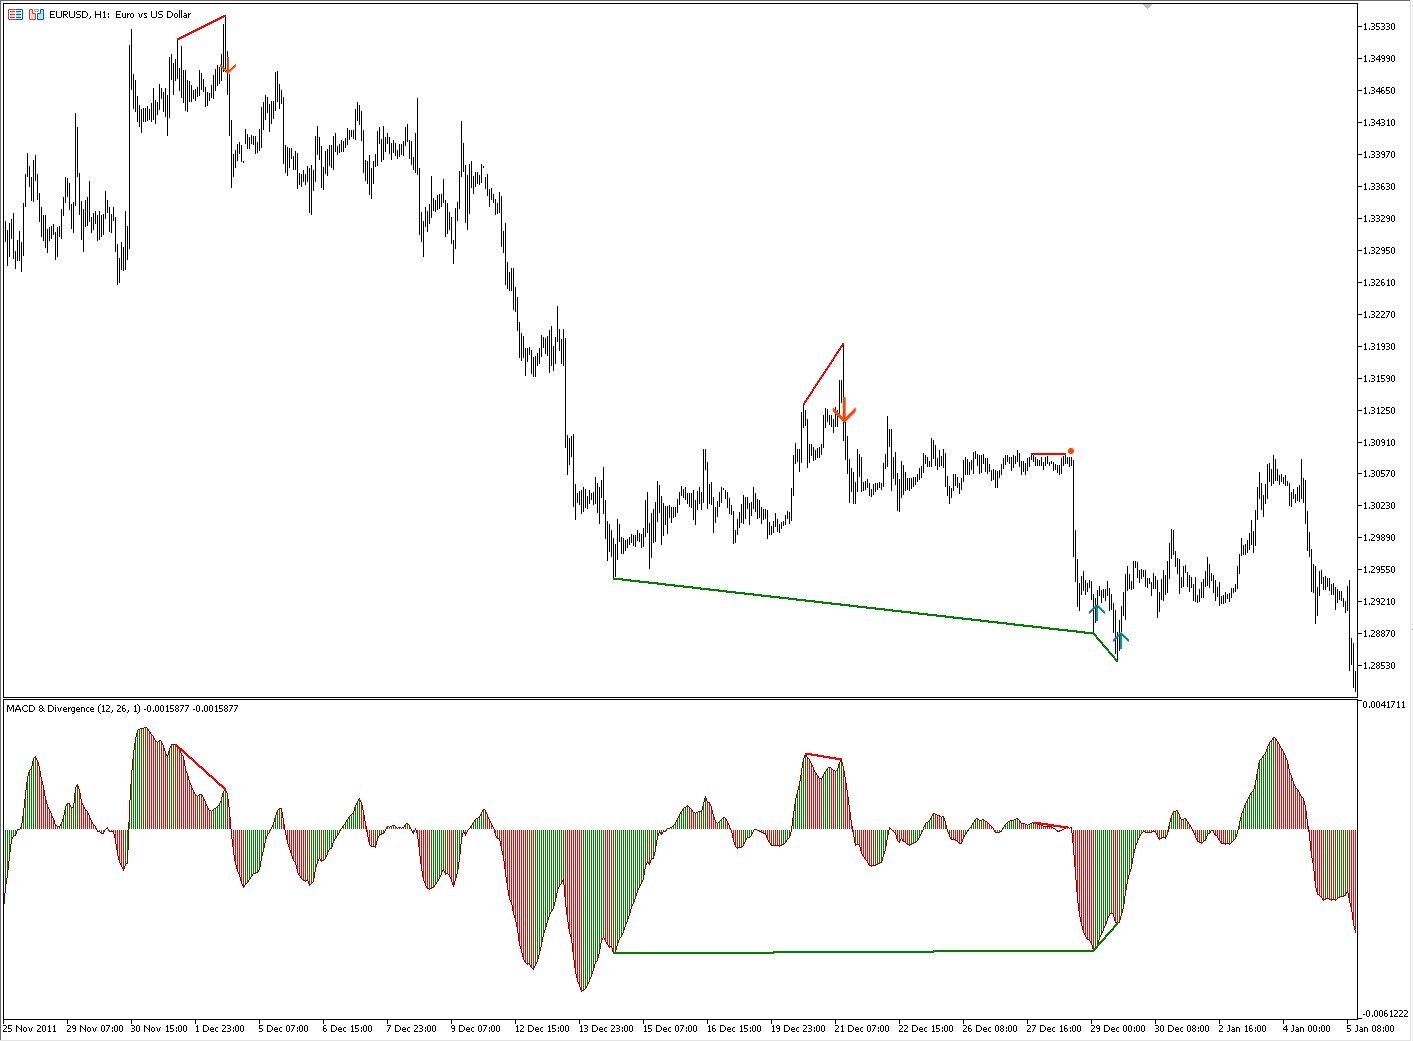
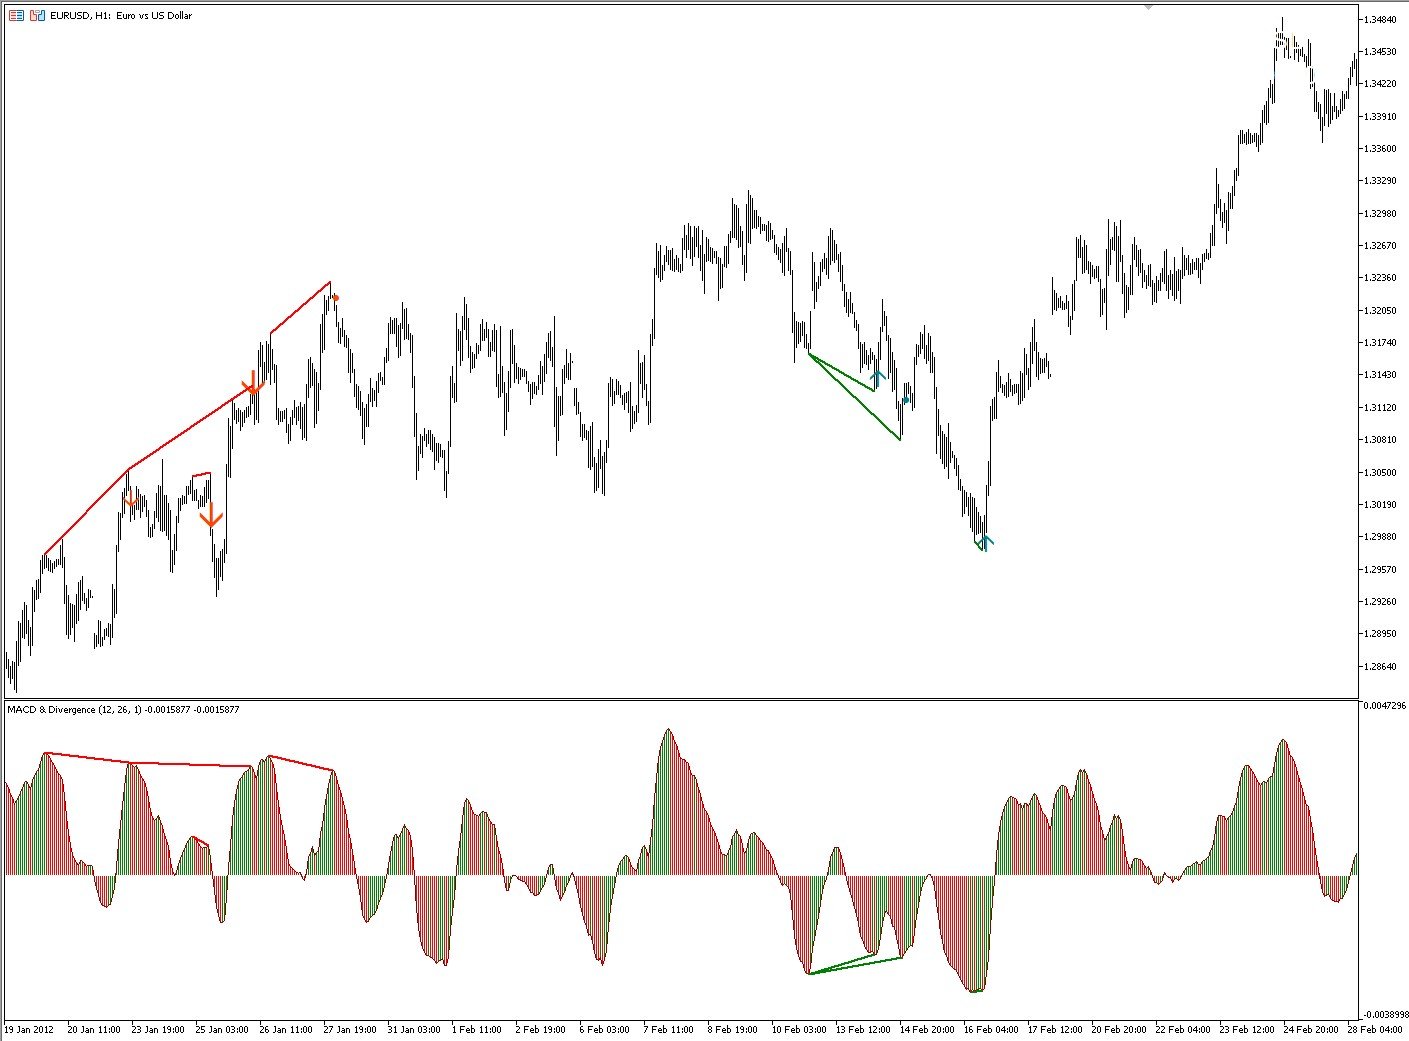
- Divergencia Alcista (Convergencia): Se produce cuando las líneas que conectan los valles del MACD y los valles correspondientes del gráfico de precios tienen pendientes opuestas y convergen.
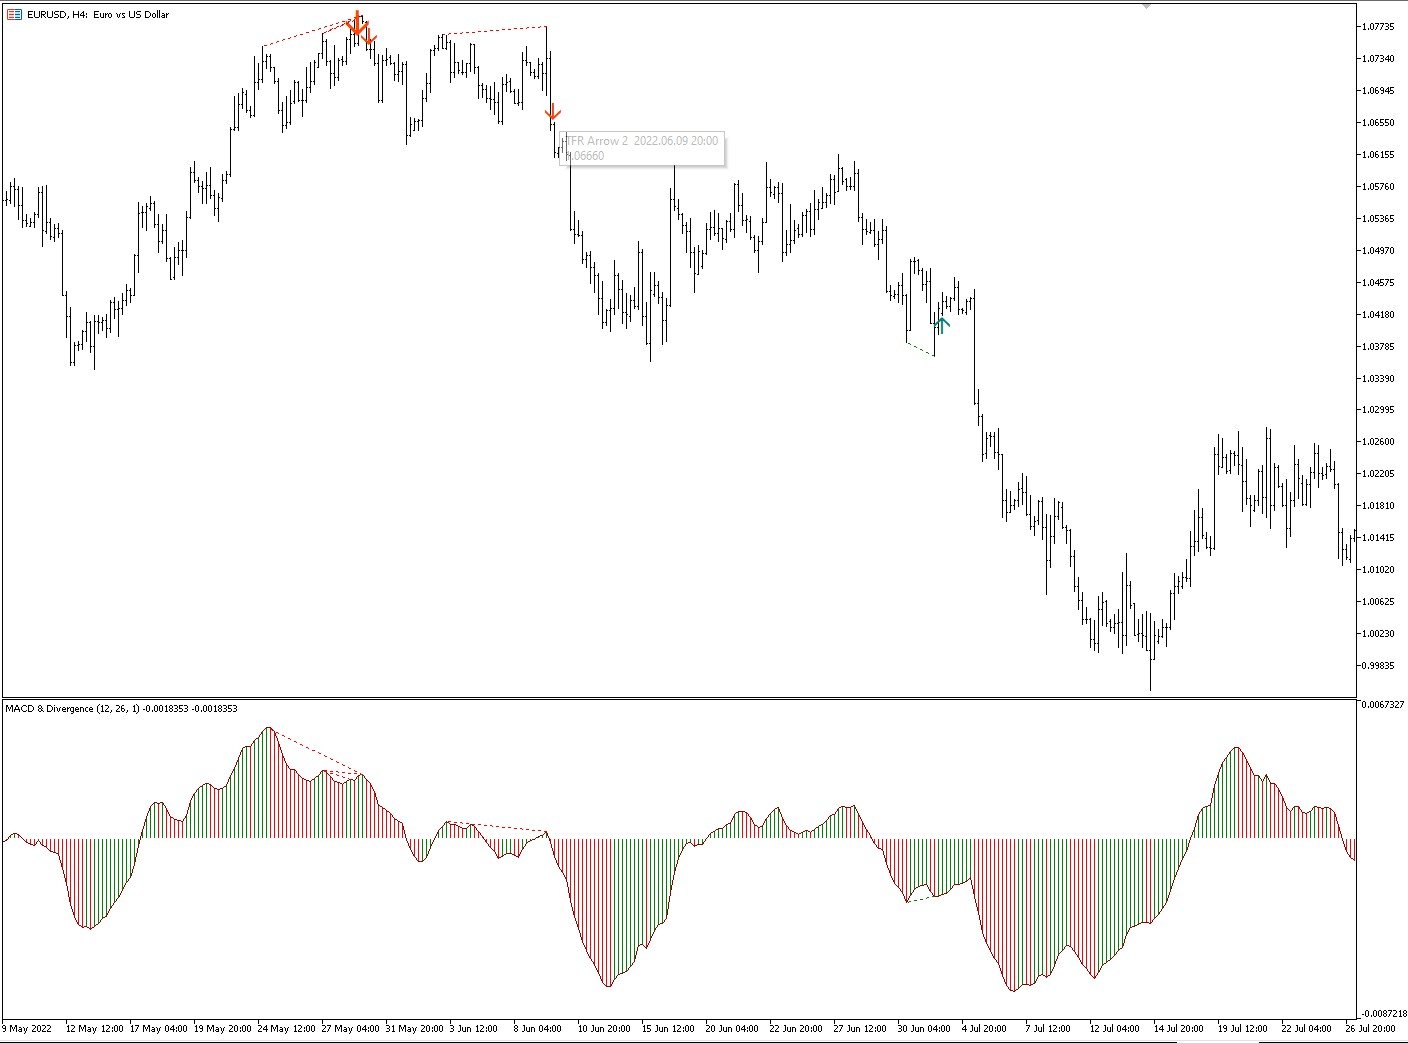
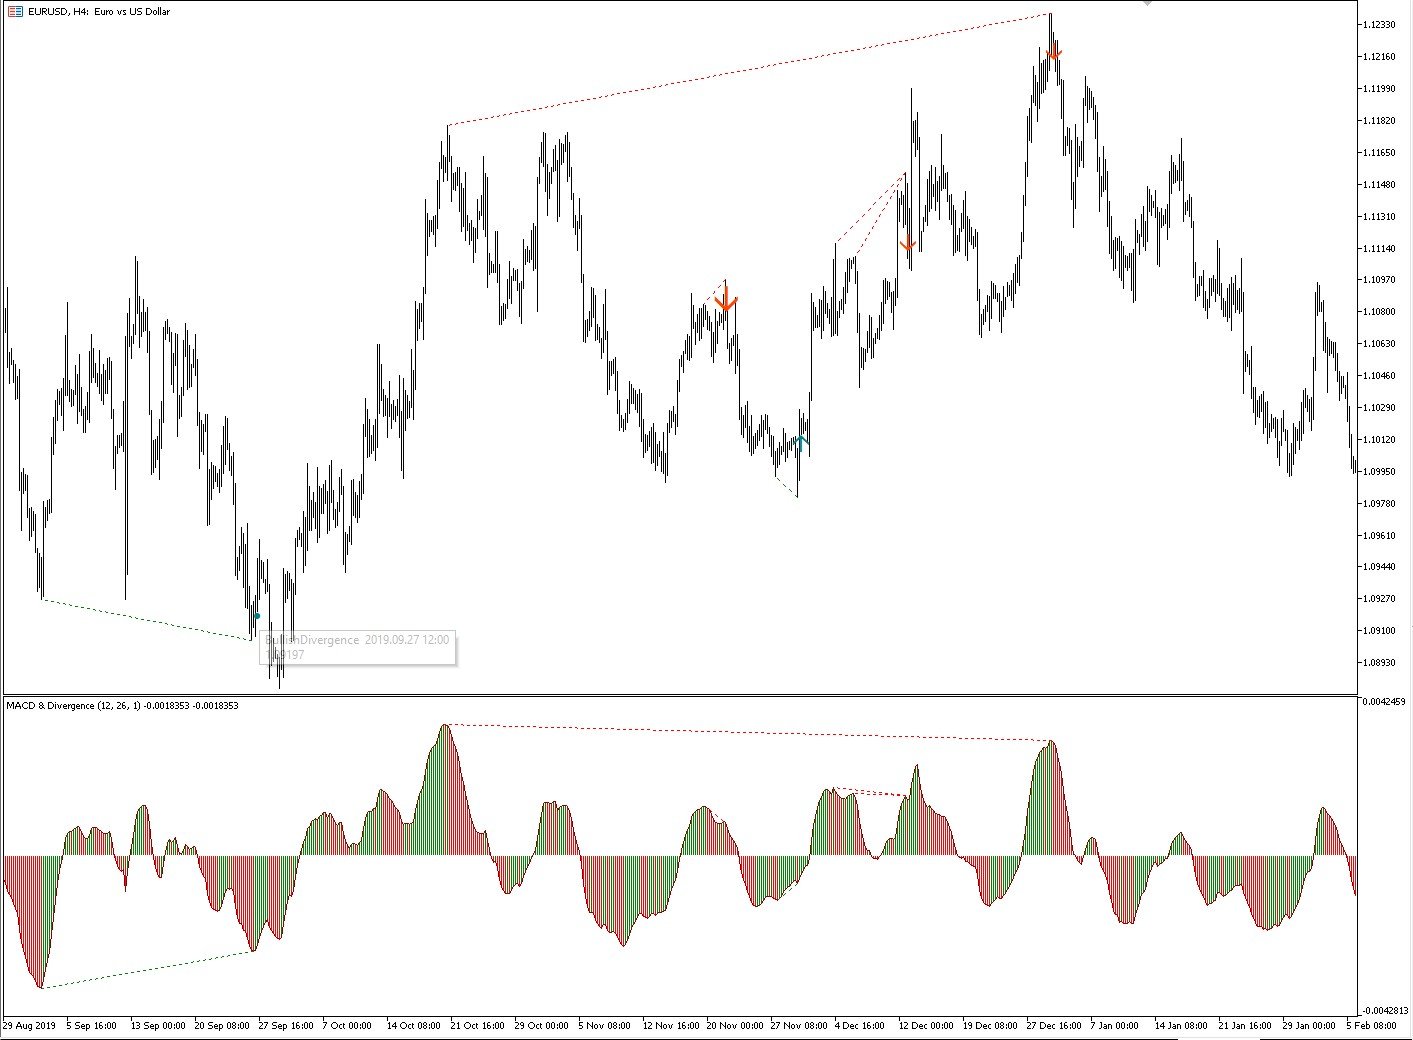
- Divergencia Bajista: Se produce cuando las líneas que conectan los picos del MACD y los picos correspondientes del gráfico de precios tienen pendientes opuestas y divergen.
Cuando se detecta una señal de divergencia, el indicador marca el gráfico con puntos en el nivel de precio y momento correspondiente a la señal.
Características Adicionales:
El indicador integra señales del sistema de trading de Darek Dargo, conocido como TFR (The First Red). Si una divergencia coincide con una señal TFR, se muestran flechas direccionales en el gráfico, resaltando la señal fortalecida.
Histograma MACD:
- El histograma está coloreado para mayor claridad:
- Barras rojas indican un valor más alto comparado con la barra anterior.
- Barras verdes indican un valor más bajo comparado con la barra anterior.
- Un cambio de color de rojo a verde por debajo de la línea cero sugiere una posible oportunidad de compra. De manera similar, un cambio de color de verde a rojo por encima de la línea cero indica una posible oportunidad de venta.
- Las señales de divergencia y TFR actúan como filtros, agregando confirmación a estos momentos.
Detalles Técnicos:
El histograma MACD se calcula como la diferencia entre una media móvil exponencial de 12 períodos y una de 26 períodos. La línea de señal no participa en el patrón de divergencia, asegurando que el enfoque se mantenga en la dinámica del histograma.
It perfectly shows divergence and divergence through zero. I would like to have such an indicator for AO and AС