Trend Renewal Indicator
- Indicadores
- Versión: 1.0
- Activaciones: 5
1. DESCRIPCIÓN GENERAL DEL INDICADOR DE RENOVACIÓN DE TENDENCIA
El indicador de renovación de tendencia (TRI) es un indicador de seguimiento de tendencia sencillo pero muy potente que funciona en la plataforma de negociación MT5 de MetaQoutes (MLQ5).
El indicador TRI se adapta a cuentas pequeñas y grandes, y es ideal para cuentas muy grandes. Ha sido utilizado durante décadas por gestores de fondos y operadores institucionales, pero nunca se había ofrecido a operadores minoristas.
El TRI funciona con cualquier instrumento, incluidas divisas, criptomonedas, metales, materias primas duras y blandas, así como índices.
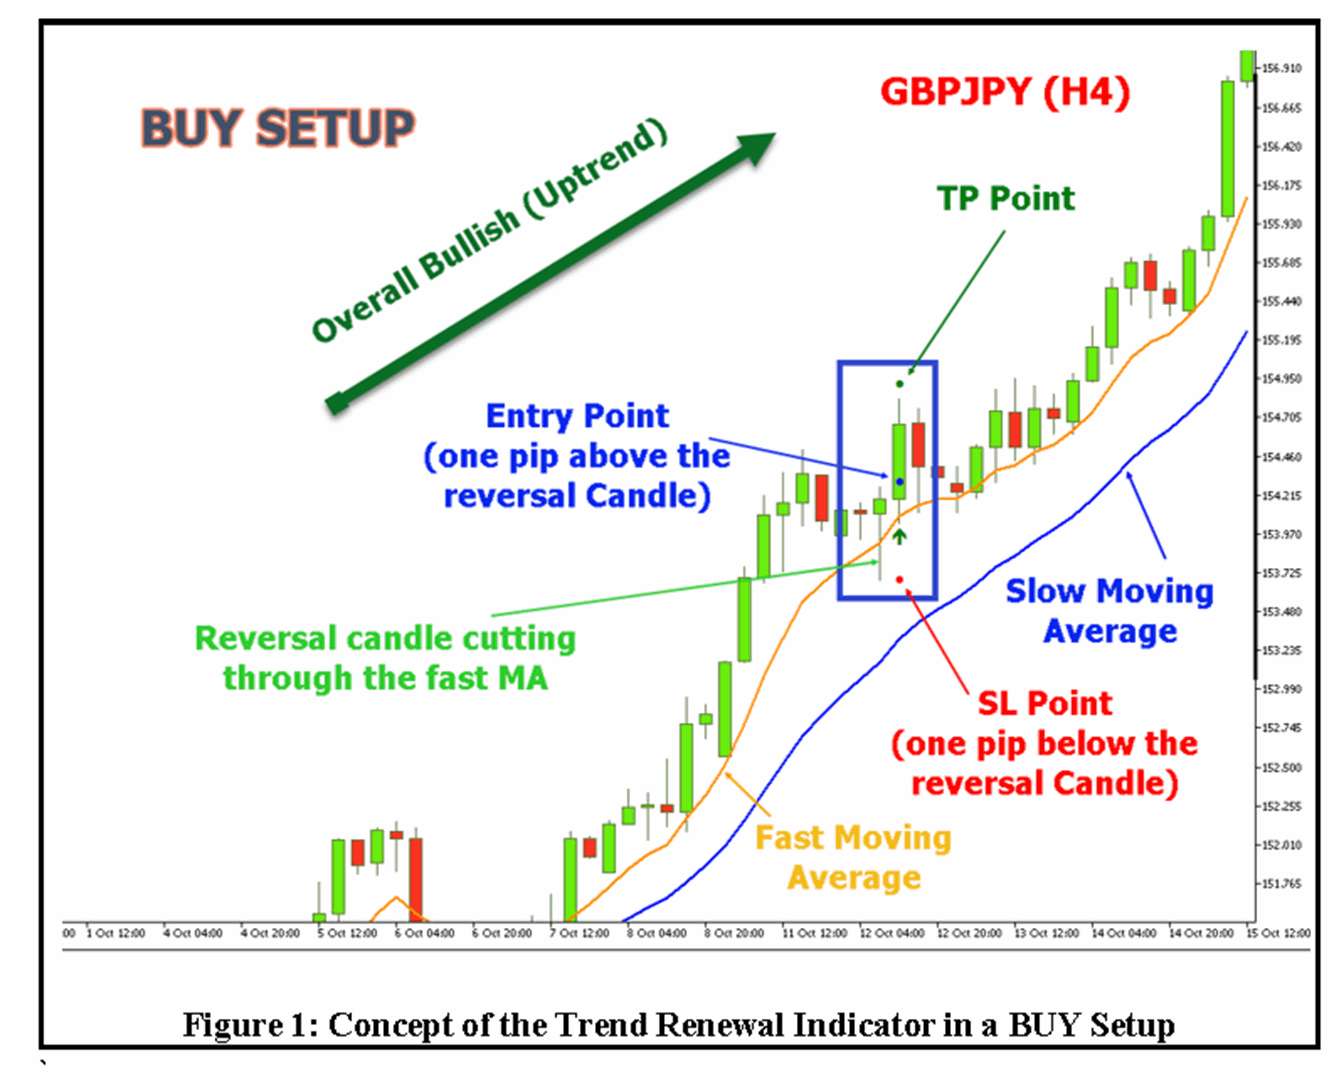
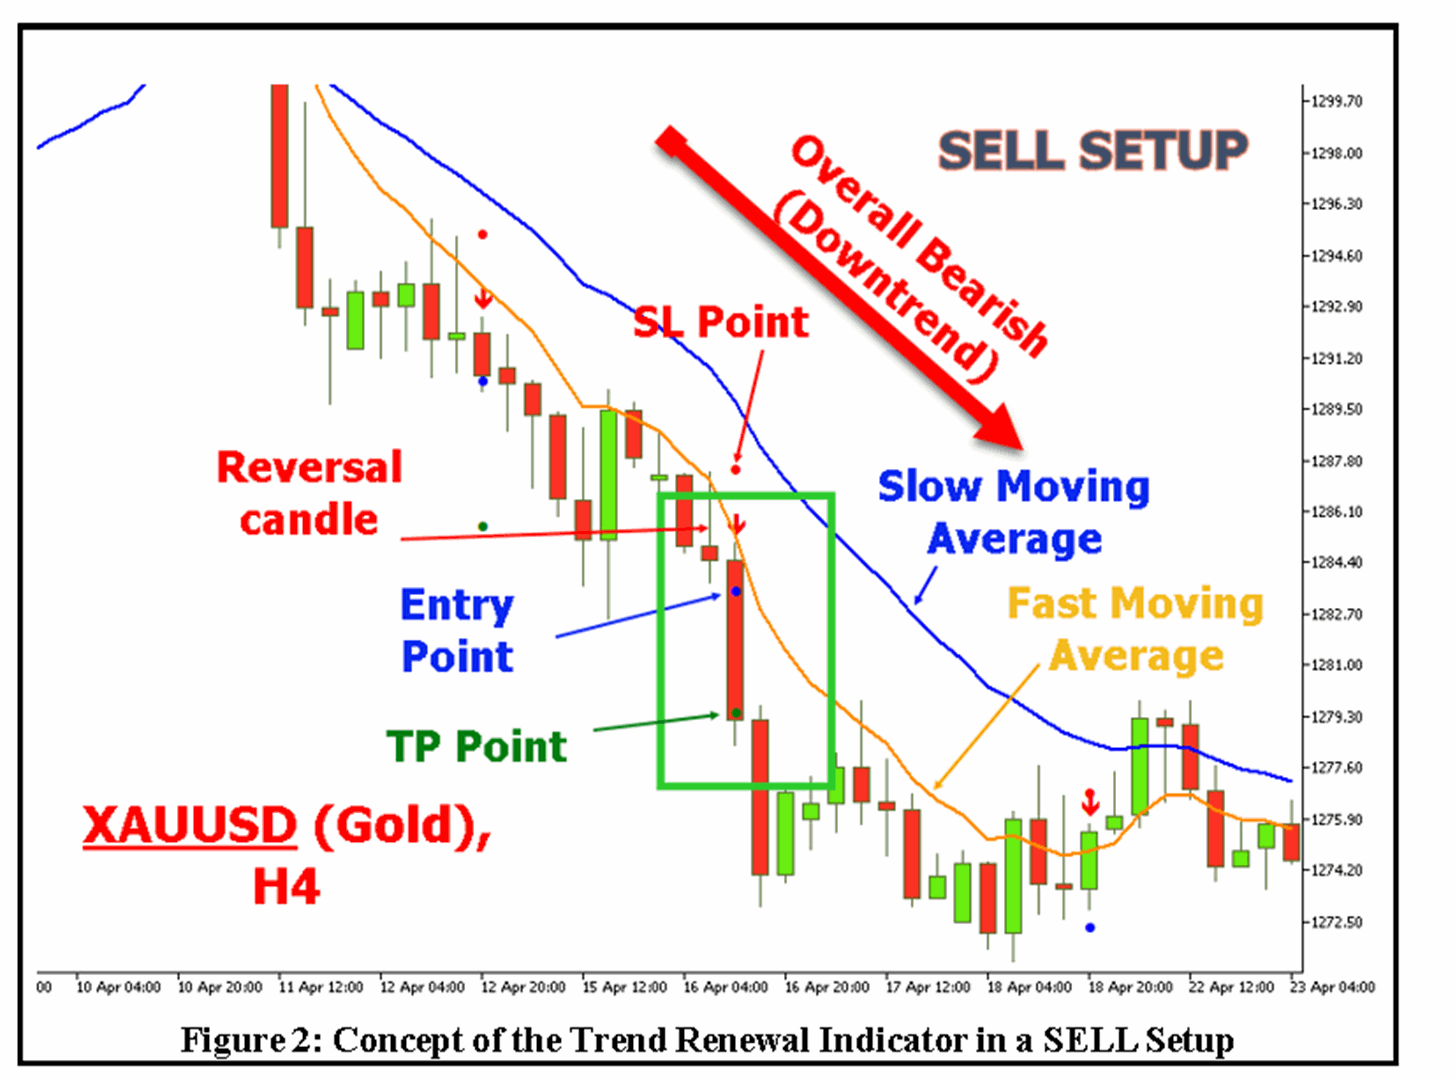
El Indicador de Renovación de Tendencia combina dos medias móviles tendenciales y una vela de inversión fuerte para generar una señal de operación que marca la continuación de la tendencia original después de un breve retroceso. En la Figura 1 se muestra un ejemplo de una configuración de COMPRA, y en la Figura 2, un ejemplo similar de una configuración de VENTA. La ejecución de una operación tras la activación de una señal requiere un análisis más detallado, como se explica más adelante; el objetivo es aplicar la discreción necesaria para tener en cuenta los posibles anuncios de noticias y las zonas de soporte y resistencia.
El TRI puede acoplarse a gráficos H1, H4 y D1, pero es ideal para los plazos más largos H4 y D1. En particular, una señal de trading en el gráfico D1 es extremadamente potente, y puede producir altas tasas de rentabilidad.
El TRI no opera con demasiada frecuencia, pero cuando la señal aparece tendrá una probabilidad de éxito muy alta. Lo ideal es que el trader adjunte el TRI a todos los gráficos en los que desee operar y espere la señal. El trader también puede activar la alerta por correo electrónico y la notificación push para recibir las señales en cuanto aparezcan.
2. CONDICIONES PARA LA SEÑAL DE ENTRADA
2.1 Configuración de compra
Una señal de entrada aparece en forma de flecha ascendente cuando se cumplen 2 condiciones: (1) la media móvil rápida está por encima de la media móvil lenta, (2) se forma una vela de inversión tras un breve retroceso del precio hacia las 2 medias móviles (véase la Figura 1). Para ello, la vela de inversión debe penetrar la media móvil rápida y su cabeza (cuerpo) debe ser pequeña en comparación con la longitud total de la vela en términos de una relación que debe especificar el usuario.
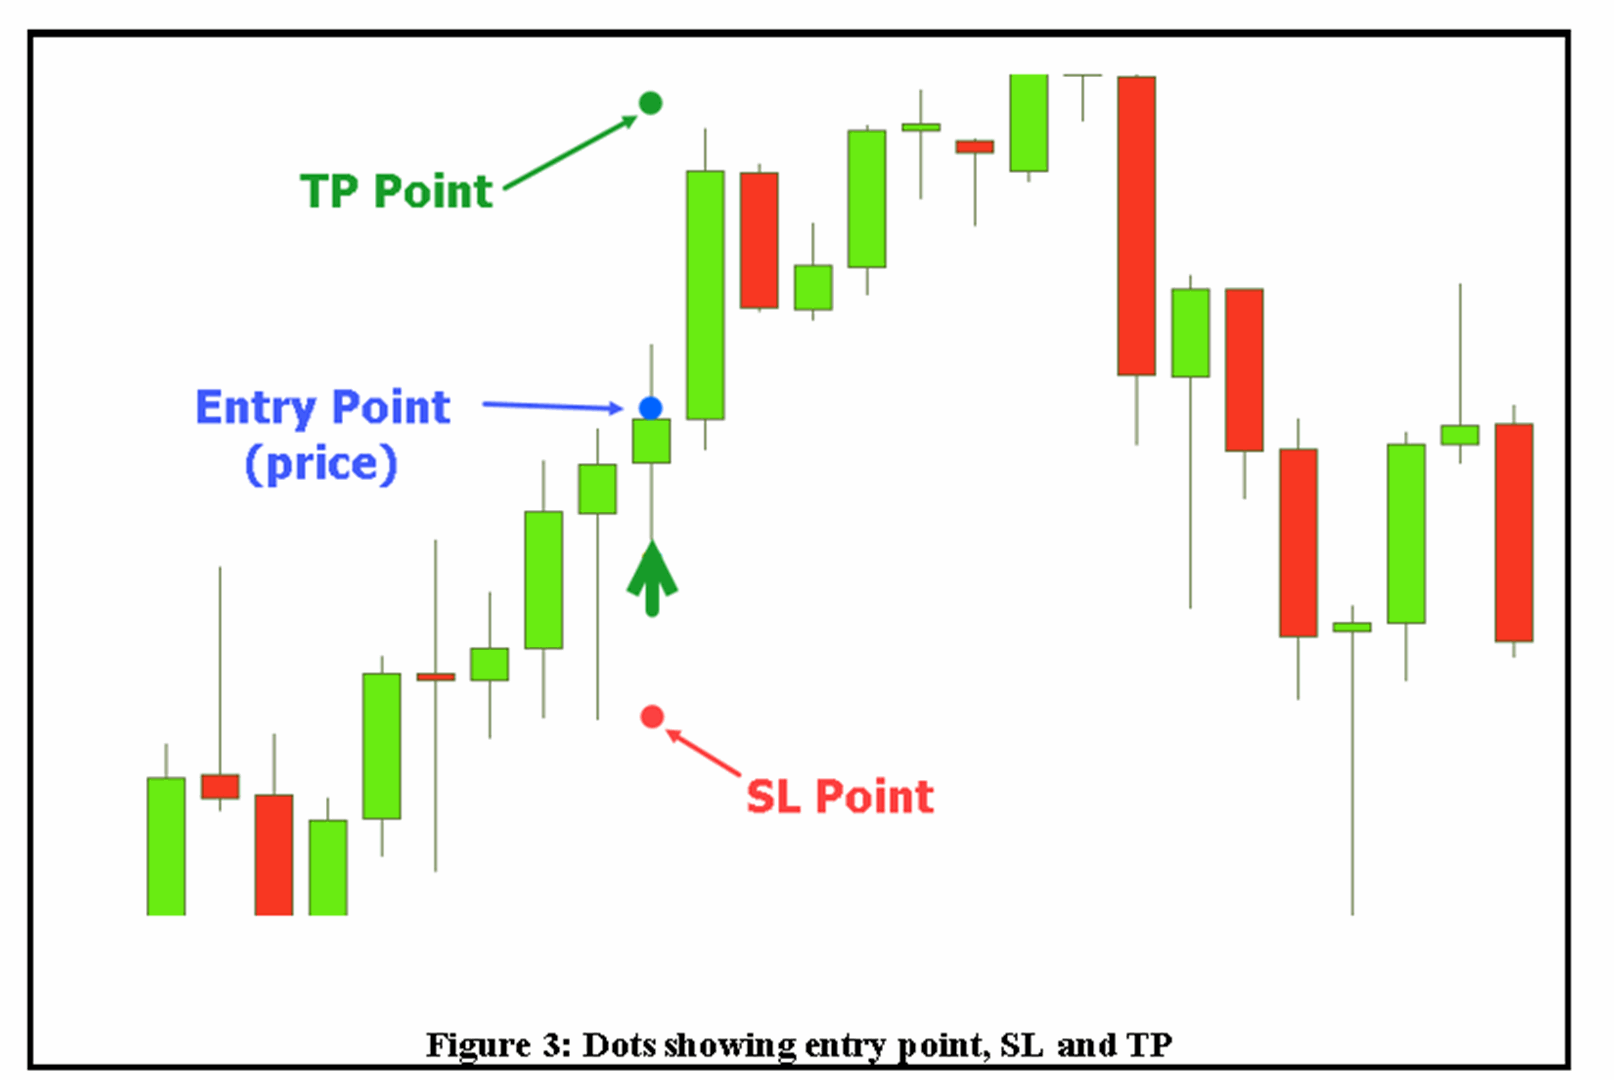
La señal activada dibujará 3 puntos en la nueva vela que se formará después de la vela de inversión (véase la figura 3). El primer punto representará el precio de entrada de una orden limitada (stop de COMPRA) a un precio superior al de la vela de inversión. El segundo punto representará el precio de stop loss (SL), que se situará justo debajo de la vela de inversión. El tercer punto determinará el nivel de precio de toma de beneficios (TP) en función de la relación recompensa/riesgo especificada por el usuario. El usuario DEBE analizar la señal antes de ejecutarla, como se detalla más adelante.
2.2 Configuración de venta
Una señal de entrada aparece en forma de flecha descendente cuando se cumplen 2 condiciones: (1) la media móvil rápida está por debajo de la media móvil lenta, (2) cuando se forma una vela de inversión tras un breve retroceso del precio hacia las 2 medias móviles (véase la Figura 2). Para ello, la vela de inversión debe penetrar la media móvil rápida y su cabeza (cuerpo) "invertida" debe ser pequeña en comparación con la longitud total de la vela en términos de una relación que debe especificar el usuario.
La señal activada dibujará 3 puntos en la nueva vela que se formará después de la vela de inversión. El primer punto representará el precio de entrada para una orden limitada (stop de VENTA) a un precio por debajo de la parte inferior de la vela de inversión. El segundo punto representará el precio de stop loss (SL), que se situará justo por encima de la vela de inversión. El tercer punto determinará el nivel de precio de toma de beneficios (TP) en función de la relación recompensa/riesgo especificada por el usuario. El usuario debe analizar la señal antes de ejecutarla, como se detalla más adelante.
AJUSTES
Puntos de entrada: Número de puntos (pips/10) por encima de la vela anterior para entrar en COMPRA o por debajo de la vela anterior para entrar en VENTA.
SL (puntos):Número de puntos (pips/10) por debajo de la vela anterior para Stop Loss en una COMPRA o por encima de la vela anterior para Stop Loss en una VENTA.
MA Rápida: Periodo, Tipo, Tipo de Precio
MA Lenta: Periodo, Tipo, Tipo de Precio
3. CÓMO UTILIZAR EL INDICADOR TRI PARA EJECUTAR OPERACIONES
El operador debe tener en cuenta cuatro factores principales antes de ejecutar la señal para aumentar la probabilidad de éxito:
1. El operador debe confirmar que el precio está realmente en tendencia antes de la configuración actual. Esto se trata en la Sección 3.1.
2. El operador debe asegurarse de que las señales activadas en un marco de tiempo pequeño, como H1, se alineen con marcos de tiempo más altos, como H4 y D1. Encontrará más información al respecto en el apartado 3.3.
3. El operador debe examinar los niveles de soporte y resistencia cercanos al precio actual. Esto se explica en la Sección 3.4.
4. El operador debe comprobar si hay noticias pendientes relacionadas con el instrumento en cuestión. A este respecto, dependiendo del tipo de impacto que tenga la noticia, el operador puede optar por evitar operar unas horas antes o después del anuncio de la noticia. En el caso de noticias no programadas, el operador deberá gestionar la operación de forma objetiva.
3.1 Confirmación de una tendencia establecida antes de la señal
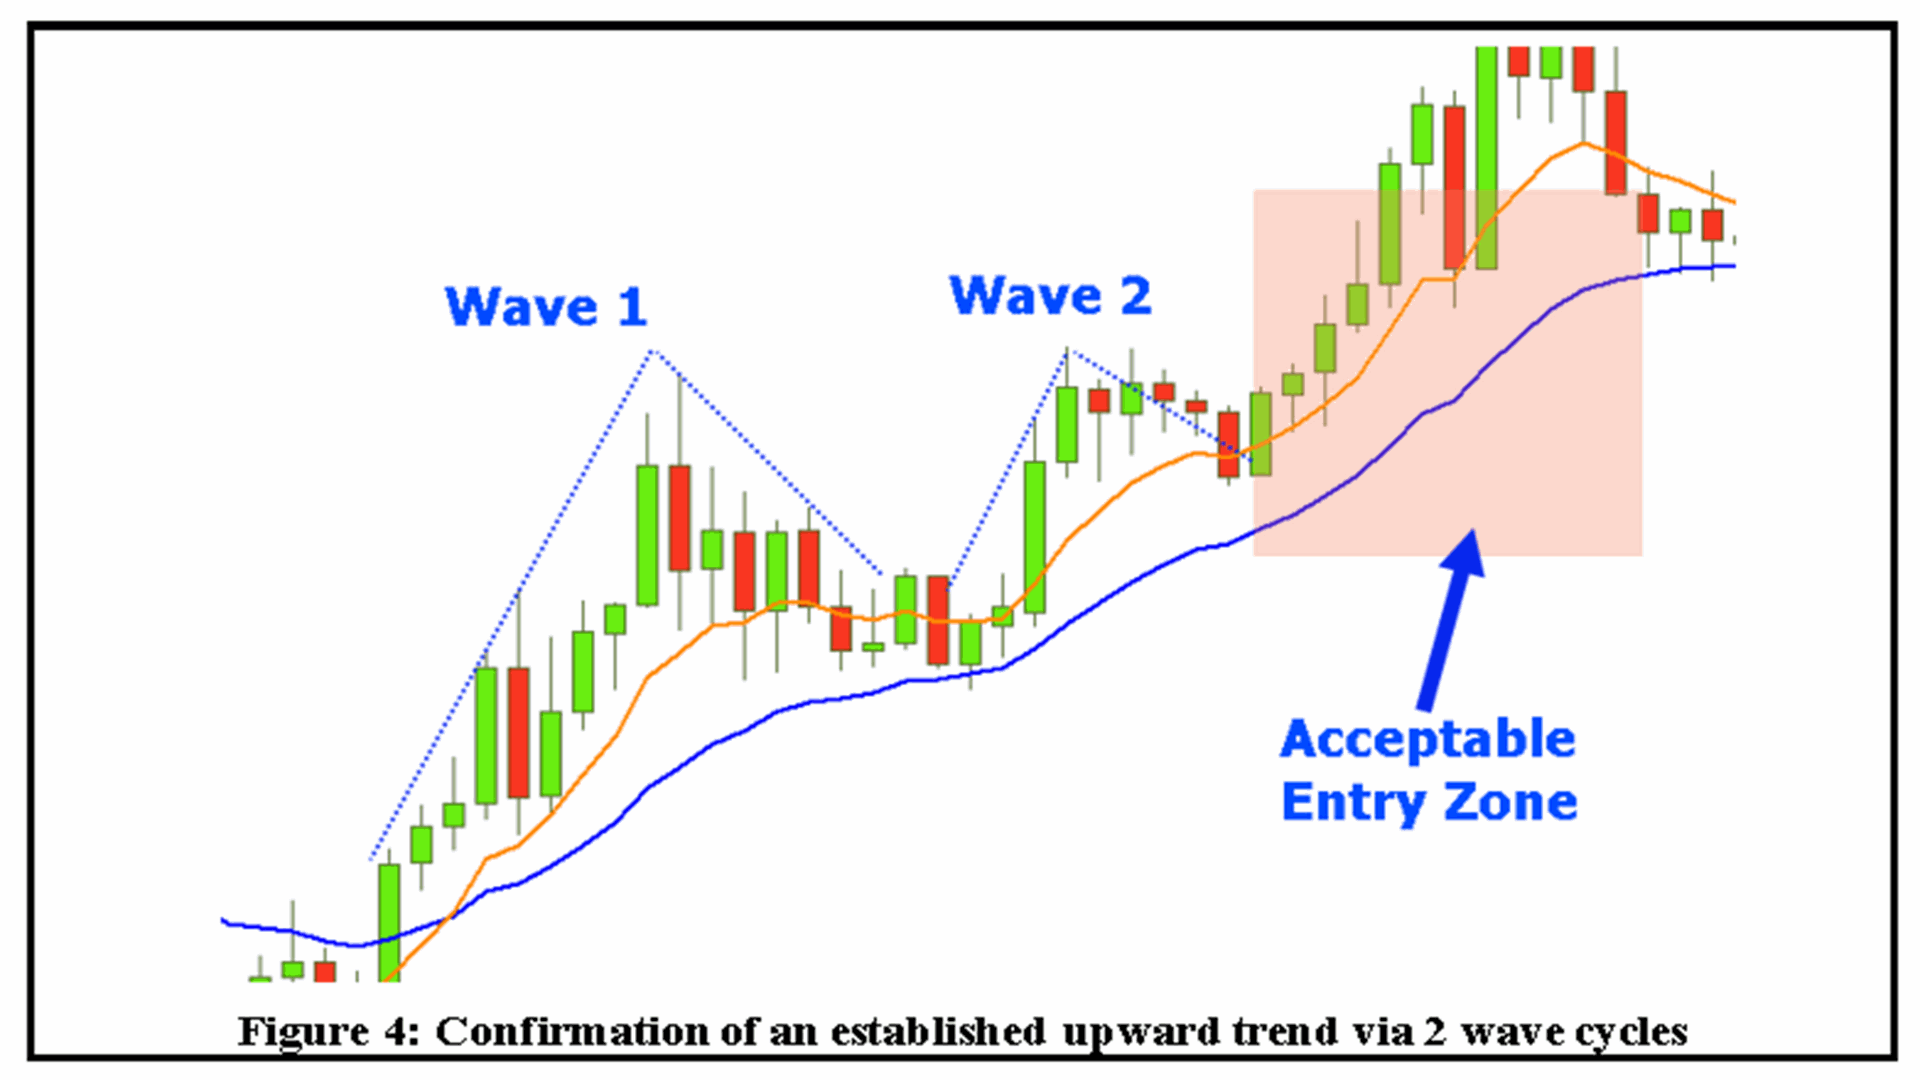
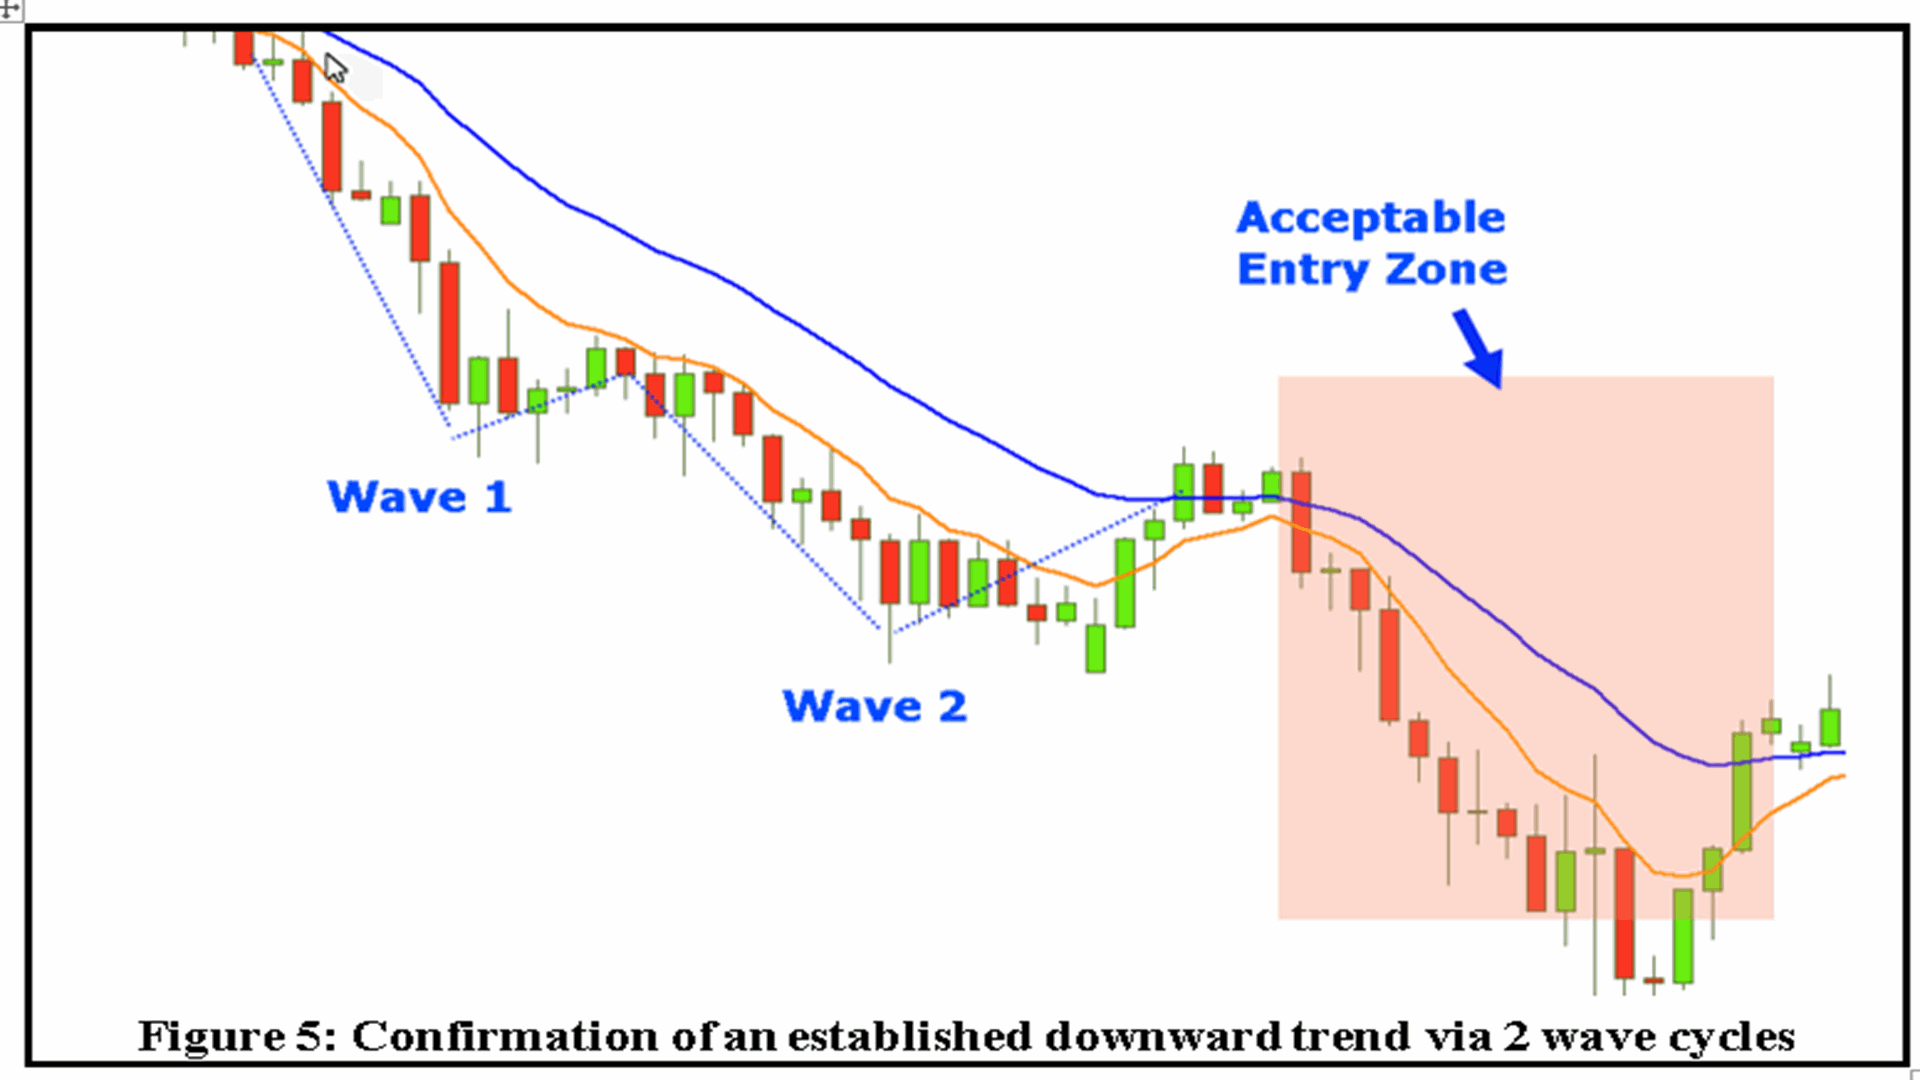
Como se ha indicado anteriormente, una señal de entrada NO DEBE ejecutarse hasta que se realice un análisis más detallado, que incluya la confirmación de que ya se había establecido una tendencia antes de la estructura de precios actual sin mucho estancamiento (es decir, evitar largos periodos laterales). Dado que el precio se mueve en ondas, se recomienda que se hayan formado al menos 2 ondas antes de entrar en la tercera. Los ejemplos de COMPRA y VENTA se presentan en la Figura 4 y la Figura 5, respectivamente.
3.2 Evitar los periodos de estancamiento
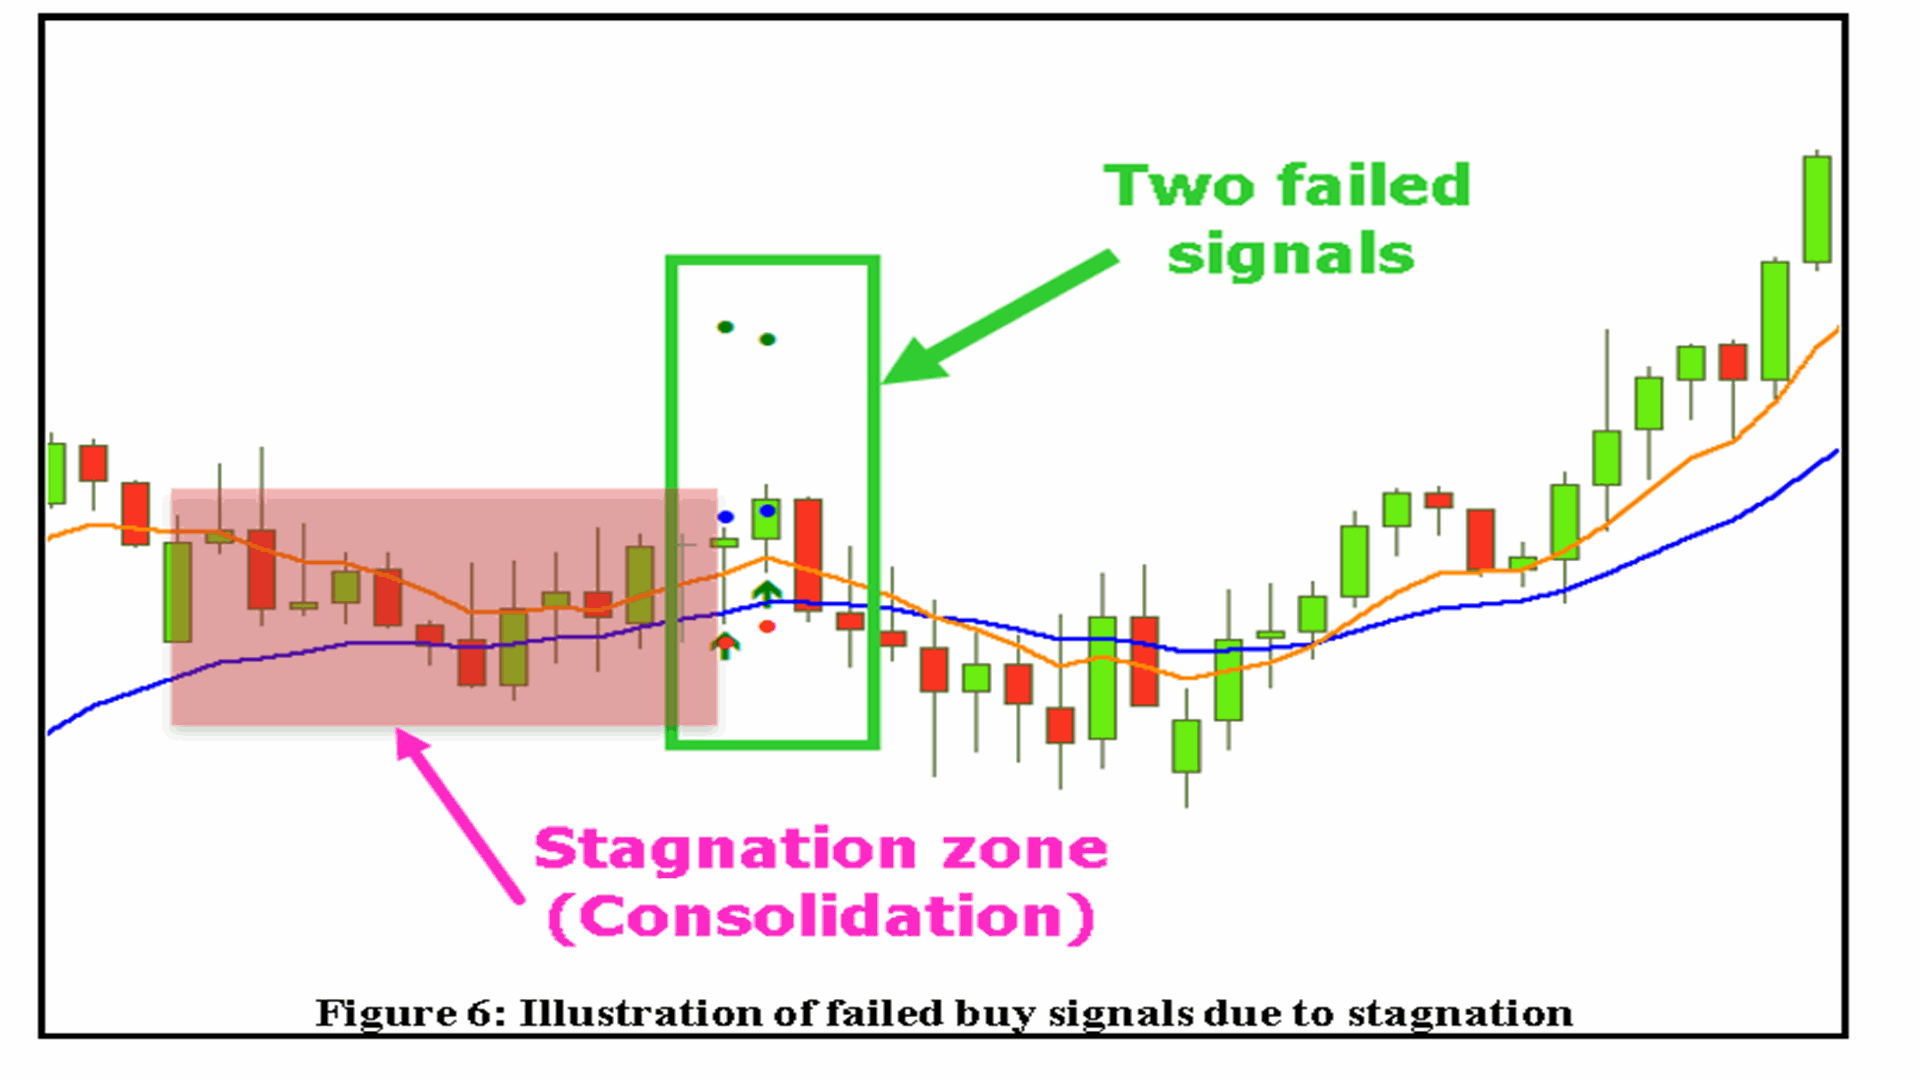
La consolidación del precio durante un periodo prolongado puede denotar una inversión general de la tendencia. Por este motivo, es aconsejable evitar la entrada cuando el precio acecha durante mucho tiempo dentro de una zona de precios. En otras palabras, el operador debe ver un ángulo razonable entre las medias móviles lenta y rápida antes de ejecutar la señal. En la Figura 6 se muestra un ejemplo de señales fallidas debidas al estancamiento.
3.3 Alineación del marco temporal pequeño con el superior
Como se ha comentado anteriormente, el TRI puede operar en los marcos temporales H1, H4 y D1. Se recomienda encarecidamente que, al operar en H1, la tendencia general del gráfico H1 se alinee con la tendencia de H4 y D1. Las medias móviles pueden utilizarse para determinar este requisito, de forma que la MA rápida esté por encima de la MA lenta para H1, H4 y D1 para la entrada de COMPRA y la MA rápida esté por debajo de las MA lentas para H1, H4 y D1 para la entrada de VENTA.
Esto también se aplica a la negociación de gráficos H4 donde la tendencia debe alinearse con la tendencia D1.
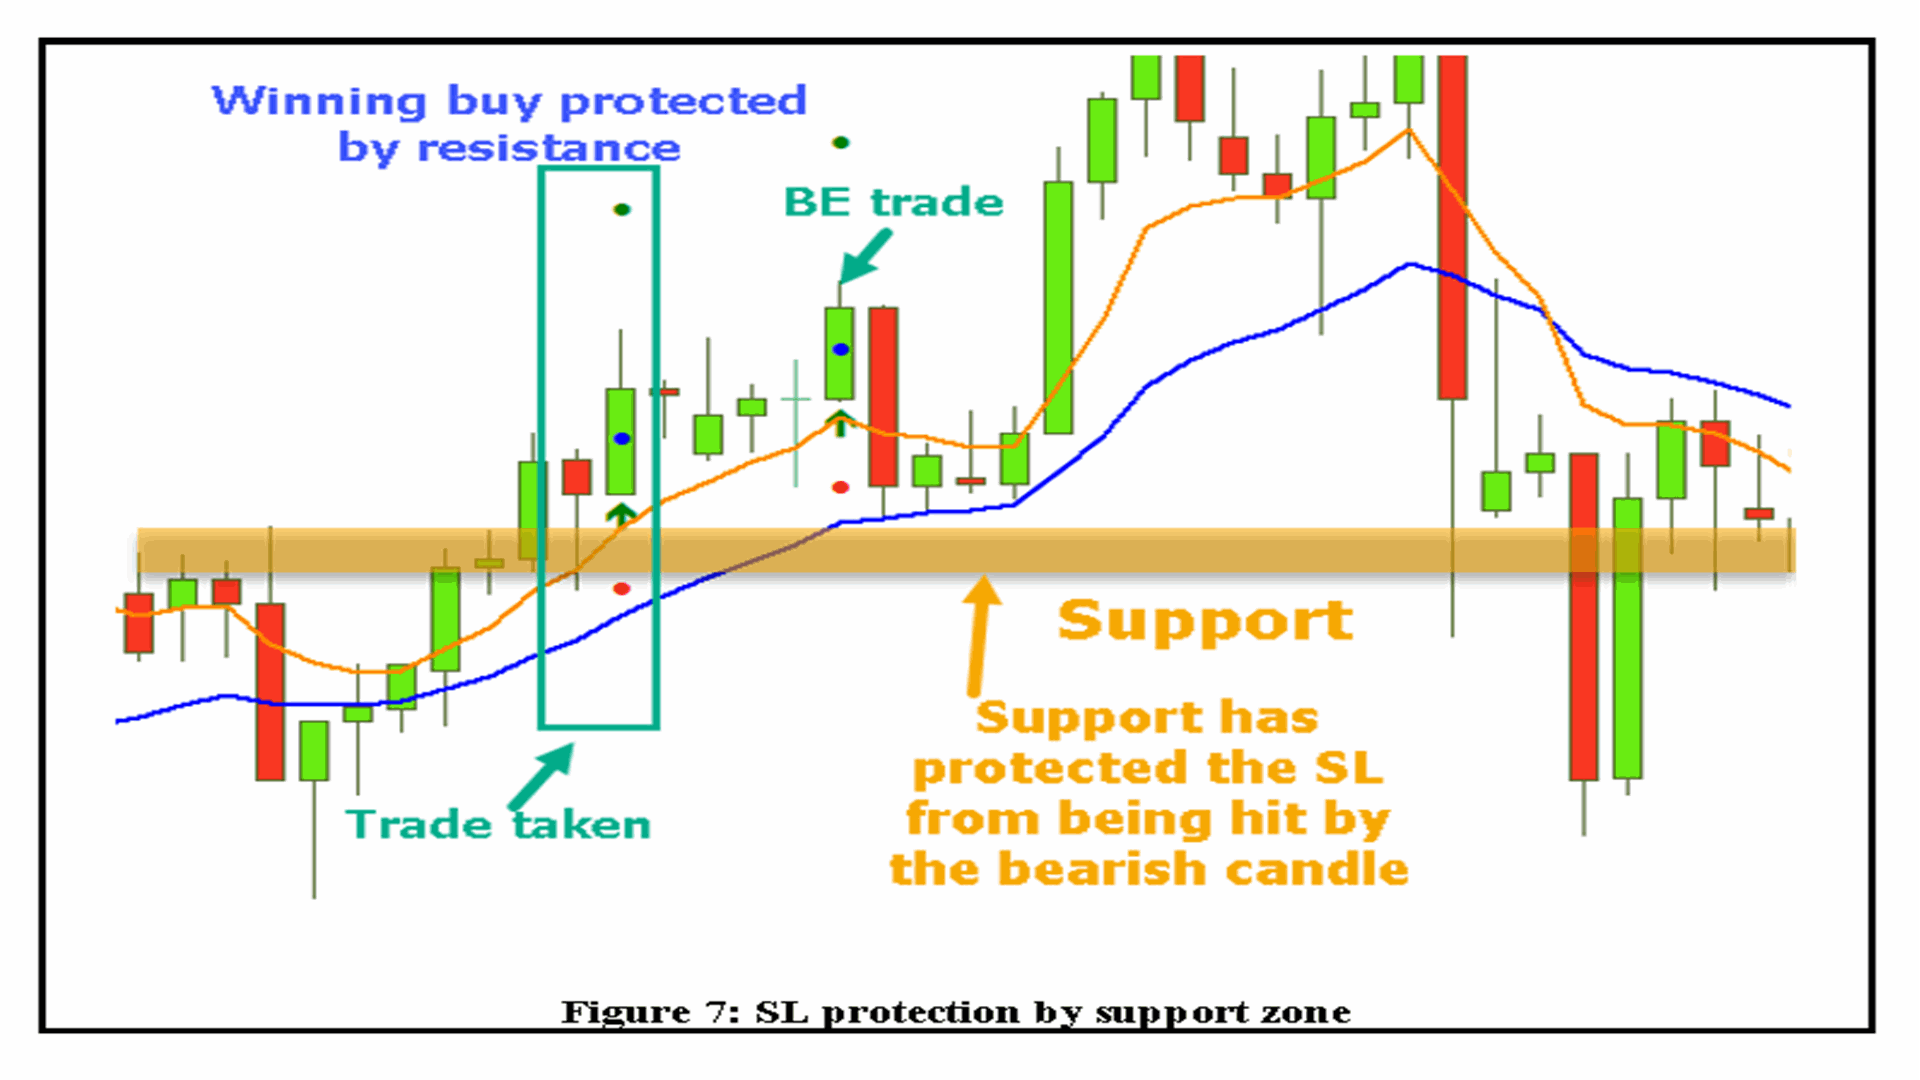
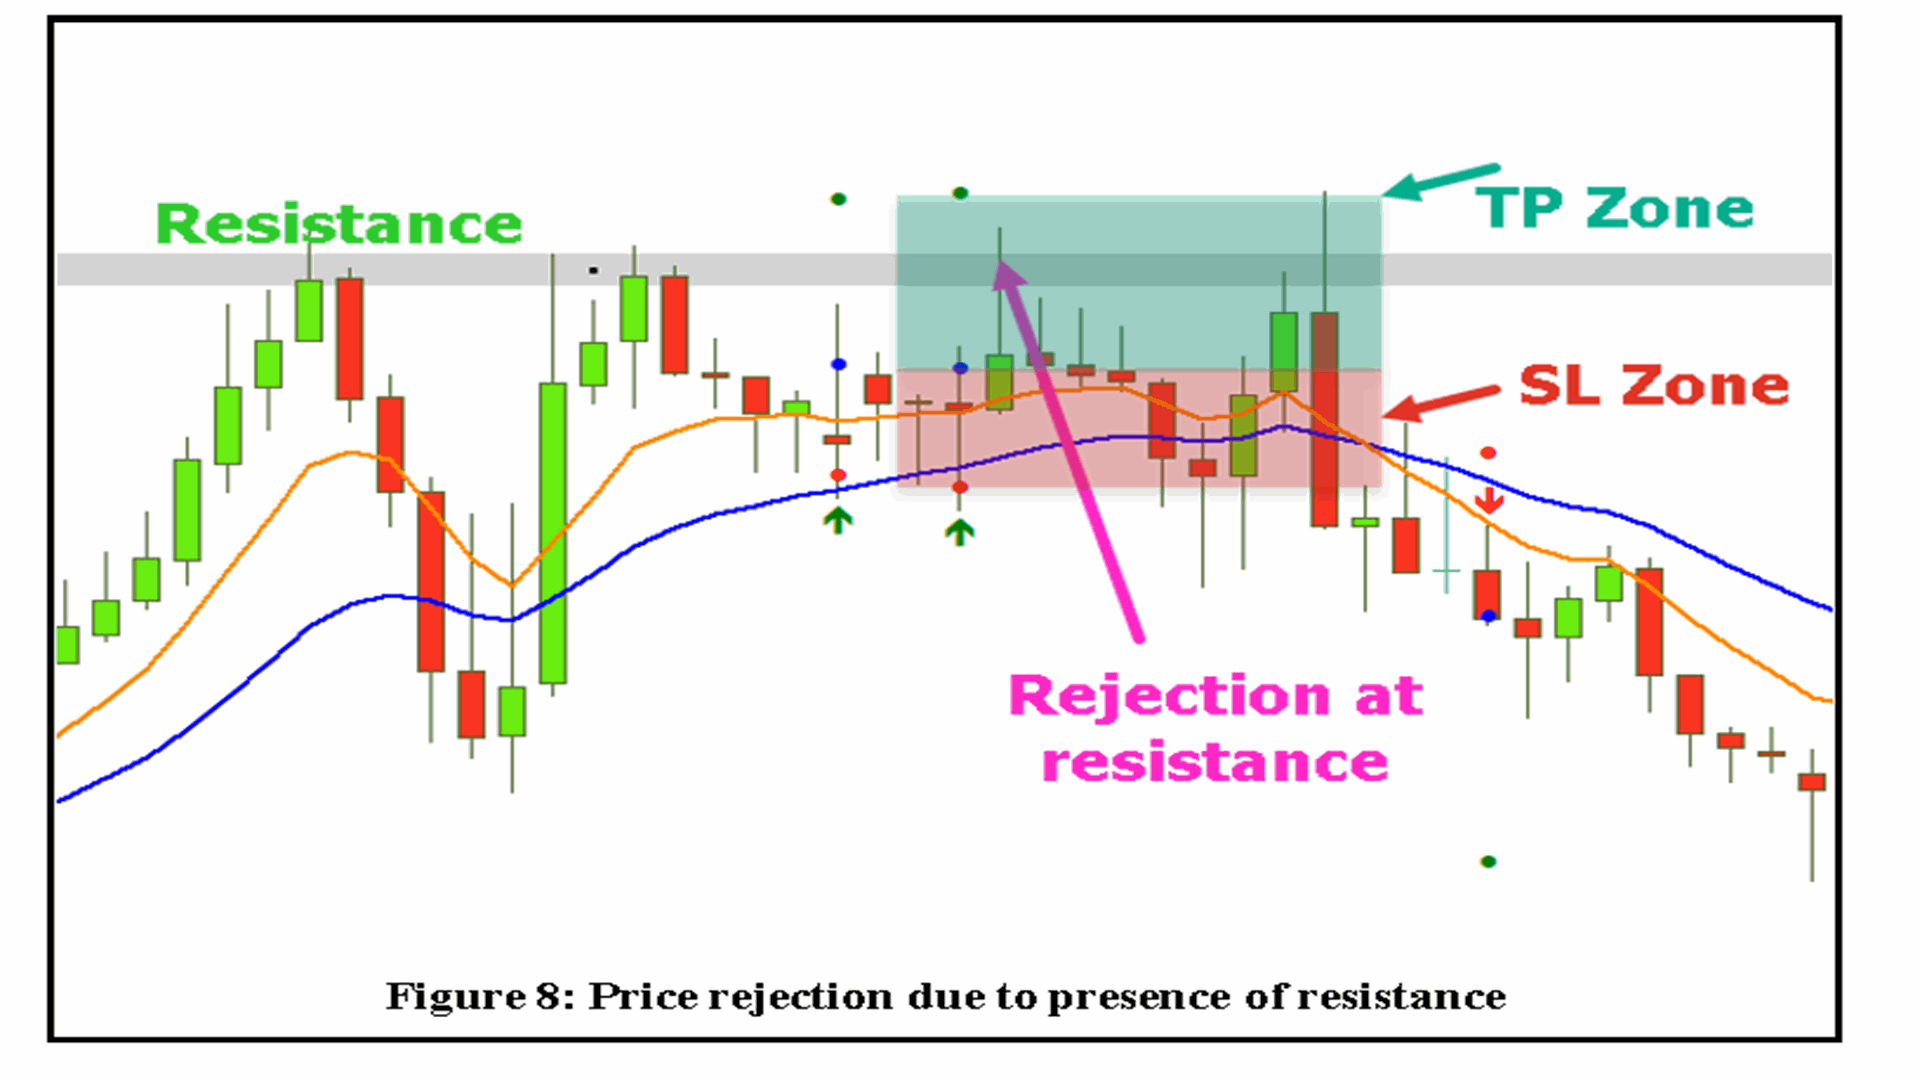
3.4 Consideración del soporte y la resistencia
Las dos zonas de precio dentro de los 3 puntos que denotan la entrada, SL y TP son generalmente sensibles a los niveles cercanos de soporte y resistencia (las dos zonas están marcadas en la Figura 8). Este efecto puede resumirse como sigue:
Señales de COMPRA
- La presencia de una zona de fuerte soporte dentro de la zona del SL puede ser positiva para la operación cuando el precio se mueve a la baja (véase la Figura 7).
- La presencia de una zona de resistencia fuerte dentro de la zona TP puede ser negativa para la operación, ya que puede provocar el rechazo del movimiento alcista (Figura 8).
Señales de VENTA
- La presencia de una zona de resistencia fuerte dentro de la zona SL puede ser positiva para la operación cuando el precio se mueve al alza.
- La presencia de una zona de soporte fuerte dentro de la zona TP puede ser negativa para la operación, ya que puede provocar el rechazo del movimiento de tendencia bajista.
Tenga en cuenta que entrar o rechazar una operación puede depender de la ubicación exacta de las zonas de soporte y resistencia con respecto al SL y TP de la operación mediante la gestión de la operación (cierre parcial, etc.).
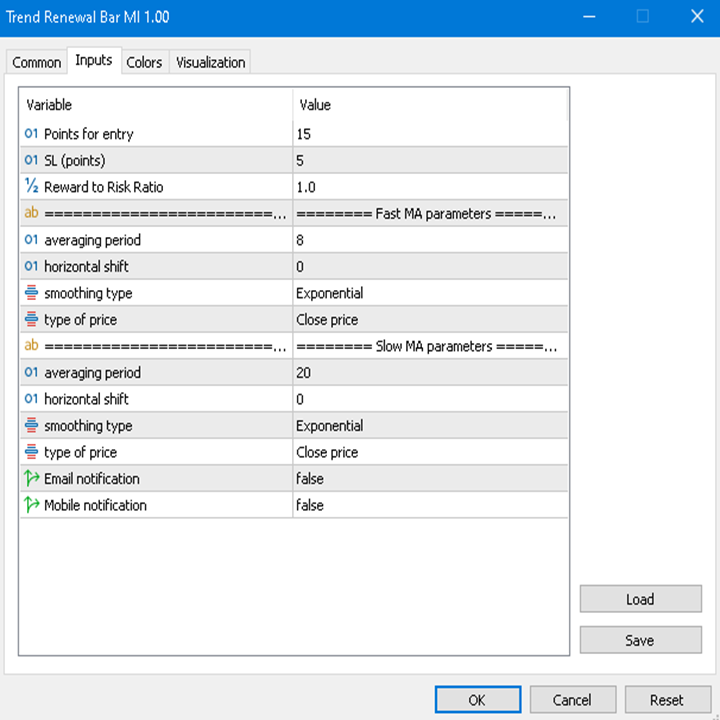
4. PARÁMETROS DEL INDICADOR TRI
En la Figura 9 se muestra una captura de pantalla de los distintos parámetros utilizados con el indicador. Observe que sólo se necesita un pequeño número de parámetros.
- Puntos de entrada (en puntos): A qué distancia se encuentra el precio de entrada de la parte superior de la vela de inversión para COMPRA o de la parte inferior de la vela de inversión para VENTA.
- Puntos SL: A qué distancia se encuentra el precio de entrada de la parte inferior de la vela de inversión para COMPRA, o de la parte superior de la vela de inversión para VENTA.
- Relación Recompensa/Riesgo: La relación entre el TP y el SL desde el precio de entrada.
- Periodo MA rápido: Periodo utilizado para la media móvil exponencial rápida
- Periodo MA Lento: Periodo utilizado para la media móvil exponencial lenta
- Relación de la cabeza de la vela de inversión: Tamaño relativo de la cabeza de la vela de inversión con respecto a la longitud total de la vela.
- Alerta por correo electrónico: Opción para recibir notificaciones por correo electrónico
- Notificación Push: Opción para recibir notificaciones a través del móvil
El conjunto óptimo de parámetros se proporciona con la compra del indicador.
5. CONSEJOS IMPORTANTES
- Como se muestra en la Figura 10, la formación de una mecha antes de alcanzar el precio de entrada aumenta la probabilidad de éxito de la operación: cuanto más larga sea la mecha, mejores serán los resultados. Observe cómo la vela bajista formó una mecha superior antes de invertirse para alcanzar el punto de entrada hacia un TP completo en este ejemplo.
- Una mecha larga de la vela de inversión añade fuerza a la señal. Véase la comparación en la Figura 11. La longitud mínima de la vela de inversión puede utilizarse como criterio adicional para entrar en una operación utilizando el indicador medio verdadero (ATR) estándar.
- En general, durante la negociación se debe aplicar una gestión del riesgo y del dinero. Se recomienda limitar el riesgo máximo al 3% por operación cuando se utiliza el TRI.
- Asegurar beneficios parciales es muy recomendable como parte de la gestión de operaciones. También puede ser necesario implementar un SL de equilibrio cuando el precio se mueve en la dirección favorable.
- No se recomienda abrir una nueva operación cerca de la hora del rollover debido al movimiento errático de los precios alrededor de esta hora.
- La gestión de una operación abierta cerca de la hora del cambio de divisas puede ser crítica, ya que el movimiento errático del precio puede afectar al SL. El desplazamiento temporal del SL durante el rollover puede proporcionar una solución a este problema.
- No se recomienda operar con pares muy volátiles, como el oro y las divisas digitales, utilizando el marco temporal más pequeño de H1, debido a los grandes movimientos característicos de estos pares. Pruebas anteriores y posteriores han demostrado que el marco temporal D1 produce excelentes resultados en comparación.