Trading Tendencial: complete guide to the free trend indicator for MT5

Trading Tendencial: complete guide to the free trend indicator for MetaTrader 5
Trading Tendencial is a free indicator for MetaTrader 5 that shows you where the market is going, marks BUY and SELL signals only when the trend is confirmed, and gives every signal a quality score from 0 to 100. All signals are calculated on closed candles: a confirmed signal does not repaint.
Download it for free here: https://www.mql5.com/en/market/product/200283

GBPUSD M15: downtrend with quality 85 and the panel showing ALIGNED.
1. What you see on the chart
| Element | What it means |
|---|---|
| Trend line | Green = uptrend, orange = downtrend. It moves in steps, following the support or resistance of the move. |
| Two-layer cloud | The normal pullback zone. The strong layer sits next to the line and the soft layer reaches the ATR band. |
| ATR band (dotted) | The edge of the cloud. It is the dynamic stop loss: if price crosses it, the trend idea is no longer valid. |
| BUY / SELL arrows with a number | Confirmed trend change. The number is the signal quality (for example, "BUY 76"). |
| Small dots | Pullback entries: price came back to the trend line and closed bouncing in the trend direction. |
| Colored candles | Bright color = candle with the trend. Dim color = candle against the trend (pullback). |
| Trade box | Entry, stop loss, TP1 and TP2 of the active signal. It disappears when price hits TP1, the stop, or when the trend changes. |
2. The quality score (0-100)
Every signal is rated with five filters. The more filters agree, the higher the score.
| Filter | What it checks | Points |
|---|---|---|
| Strength (ADX) | The trend has strength and the market is not ranging | 30 |
| Higher timeframe | The bigger trend goes in the same direction | 25 |
| EMA 200 | Buys above the EMA 200, sells below it | 20 |
| Momentum | The signal candle has a strong body in the trade direction | 15 |
| DI+ / DI- | Buying or selling pressure supports the move | 10 |
By default the indicator shows signals from 45 points. If you want fewer, more filtered signals, raise "Min quality score" to 60 or 70.
3. The panel, part by part
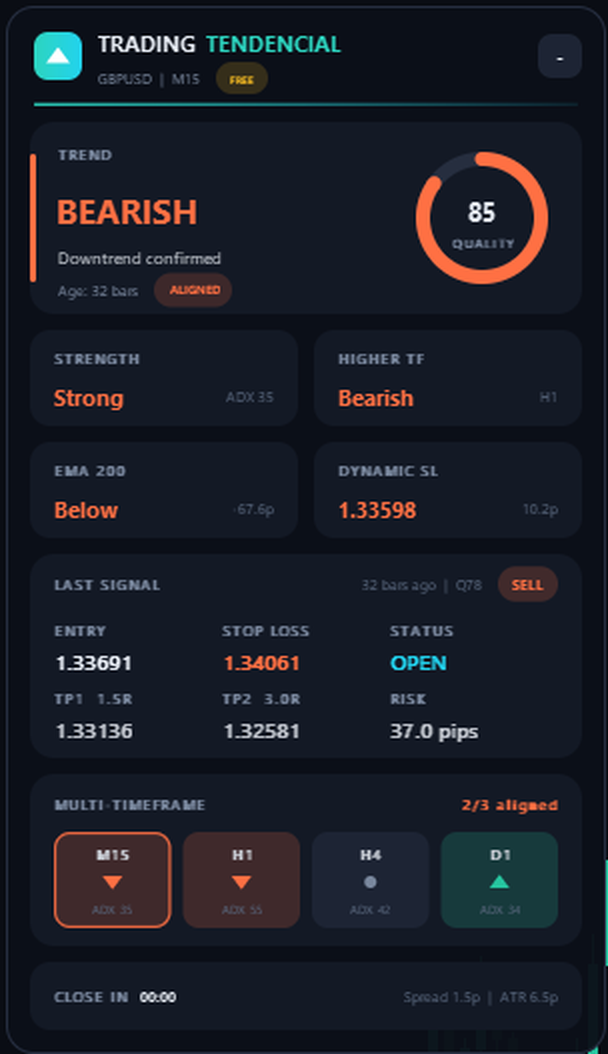
- TREND: the current trend (BULLISH or BEARISH) and how many candles it has lasted (Age). The tag next to it tells you if everything points the same way:
- ALIGNED: the higher timeframe and the EMA 200 agree with the trend.
- MIXED: only one of the two agrees.
- COUNTER: both are against the trend. Be careful.
- QUALITY (ring): the market quality right now. It turns yellow when it is below your minimum.
- STRENGTH: strength based on ADX. Ranging (ADX below 20, sideways market), Trending or Strong (ADX 30 or more).
- HIGHER TF: the trend of the higher timeframe. It is chosen automatically: M15 checks H1, H1 checks H4, H4 checks D1.
- EMA 200: whether price is above or below it, and how many pips away.
- DYNAMIC SL: the price of the ATR band, your reference stop, and its distance in pips.
- LAST SIGNAL: the last signal with its quality (Q) and how many candles ago it appeared. It shows entry, stop loss, TP1, TP2, risk in pips and the status:
- OPEN: the trade is still running.
- TP1 HIT: price reached TP1.
- STOPPED: price hit the stop.
- EXIT: closed because the trend changed.
- MULTI-TIMEFRAME: the trend on 4 timeframes (M15, H1, H4 and D1 by default) with their ADX. Up arrow = bullish, down arrow = bearish, dot = no trend. Your chart's timeframe has a border.
- CLOSE IN: time left until the candle closes, plus spread and ATR.
Drag the panel from its top bar and minimize it with the "-" button. If the text looks small on your screen, set "Panel scale" to 1.2 or 1.5.
4. How to trade with Trading Tendencial
The rule is simple: enter only when the arrow, the panel and the quality agree.
Buy:
- A BUY arrow appears on a closed candle.
- Quality is 70 or higher and the panel shows ALIGNED.
- Most timeframes in the panel point up.
- Enter at the open of the next candle.
- Place the stop at the DYNAMIC SL (the ATR band). Size the lot to risk 1% of your account or less.
- At TP1 close half and move the stop to entry. Let the rest run to TP2.
Sell: the same in reverse. SELL arrow, quality 70 or higher, panel ALIGNED and timeframes pointing down.
Pullbacks: if you missed the start of the trend, the small dots give you a second chance to enter with the trend, with the stop at the ATR band.
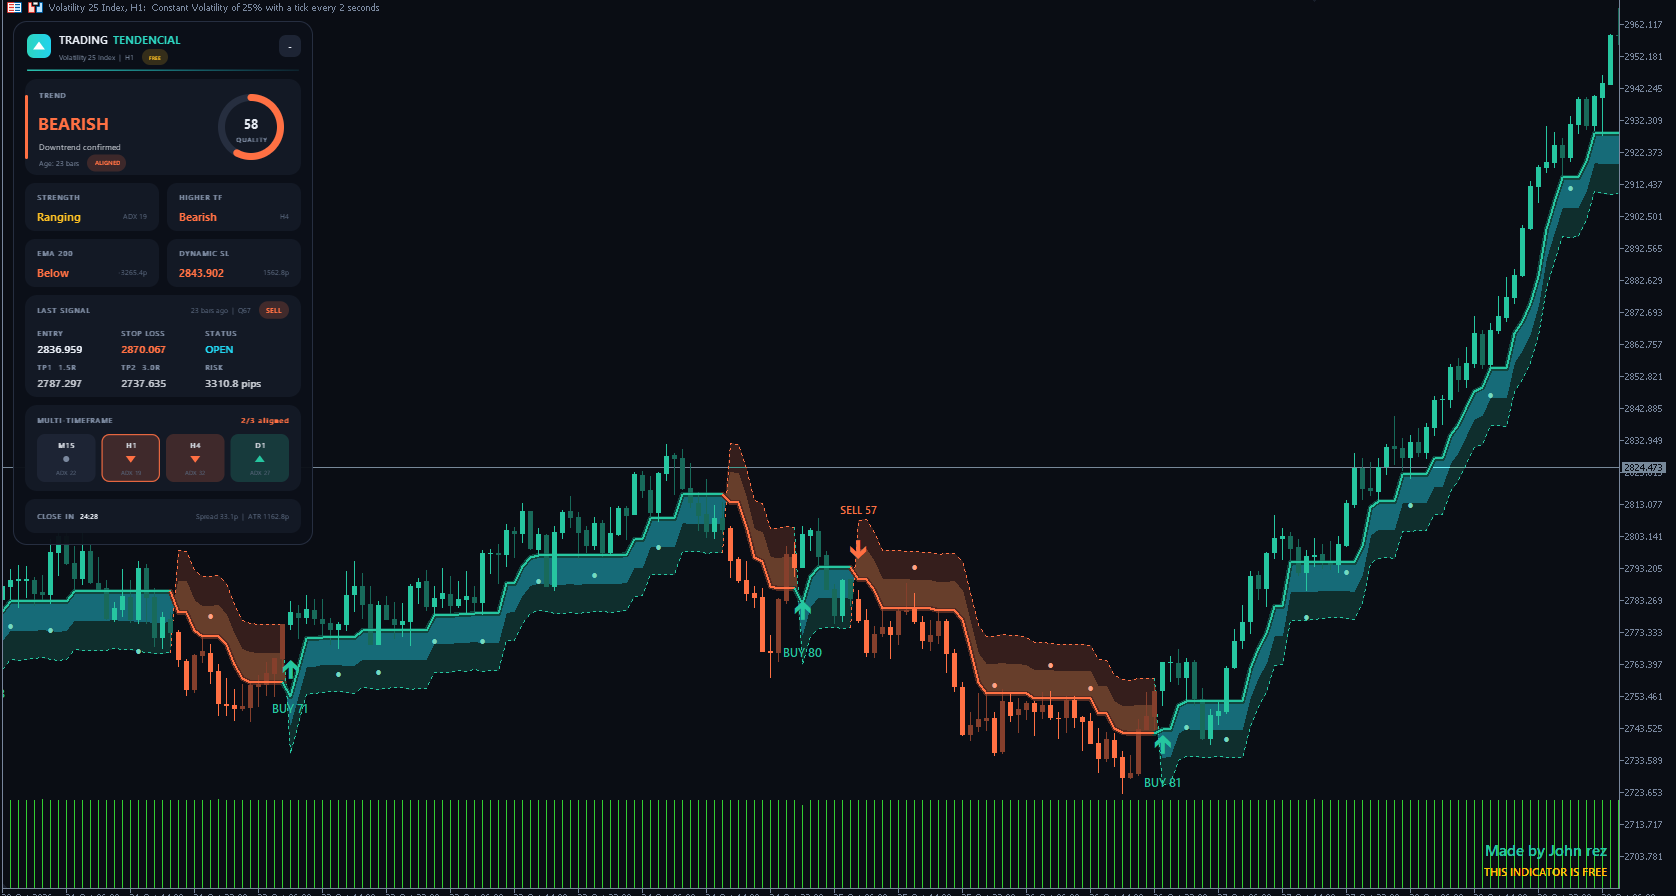
Volatility 25 Index H1: it also works on synthetic indices.
5. When NOT to trade
- STRENGTH shows "Ranging": ADX is low and the market moves sideways. Signals fail more often.
- The panel shows COUNTER: the higher timeframe and the EMA 200 are against you.
- The signal appeared many candles ago and price is already far from the line: don't chase it, wait for a pullback.
- High-impact news (NFP, interest rates): wait 15 minutes before and after.
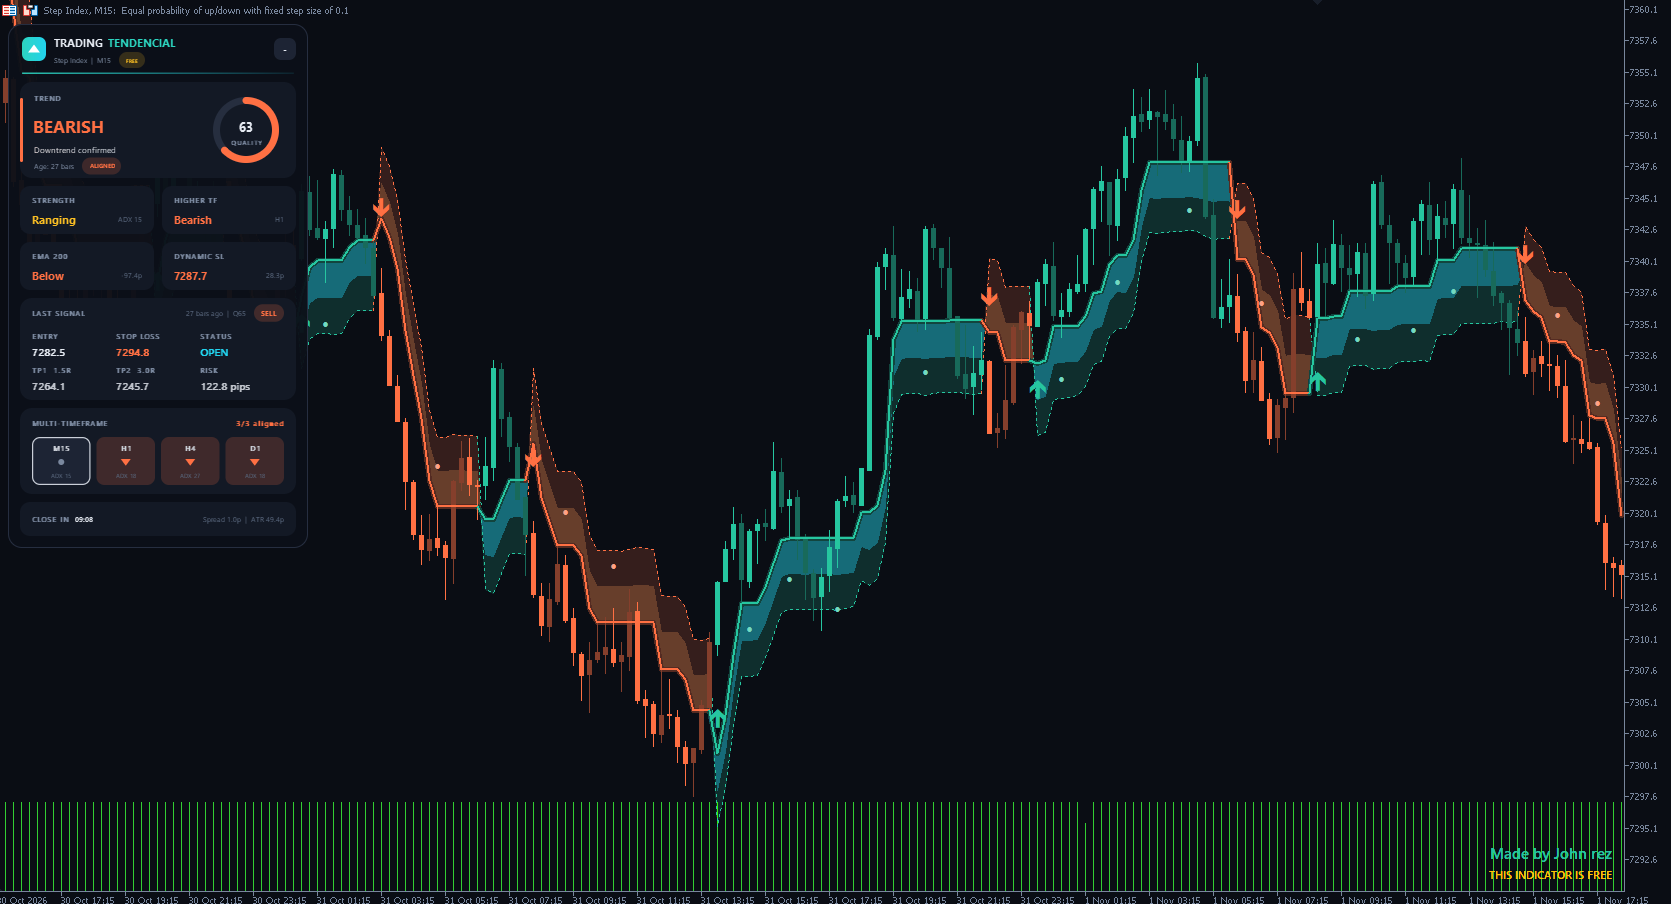
Step Index M15: the panel shows "Ranging" (ADX 15). Time to be patient.
6. Main inputs
If you are starting out, don't change anything: the automatic preset adapts the indicator to your chart timeframe.
| Input | What it does | Default |
|---|---|---|
| Parameter preset | Auto adjusts amplitude and band to the timeframe. Manual uses your values. | Auto |
| Smoothing method | SMA reacts faster, EMA gives smoother trend changes. | SMA |
| Min quality score | Hides signals below that score. | 45 |
| ADX value counted as "strong trend" | ADX level considered a strong trend. | 30 |
| Higher timeframe filter | The higher timeframe. "Current" = automatic. | Automatic |
| Baseline EMA | Period of the reference EMA. | 200 |
| Show pullback continuation dots | Shows or hides the pullback dots. | Yes |
| TP1 / TP2 (x risk) | Target distance compared to the stop. | 1.5 / 3.0 |
| Show Entry / SL / TP box | Shows the trade box of the active signal. | Yes |
| Panel corner / Panel scale | Where the panel appears and its size. | Top left / 1.0 |
| Multi-timeframe 1 to 4 | The 4 timeframes in the panel. | M15, H1, H4, D1 |
| Alerts | Popup, sound, email and push notification. | Popup and sound |
7. Installation and phone alerts
- In MetaTrader 5, log in with your MQL5 account: Tools > Options > Community.
- Open the indicator page and click Download.
- In Navigator > Indicators > Market, find Trading Tendencial and drag it onto the chart.
- For alerts on your phone: copy your MetaQuotes ID from the MetaTrader 5 app, paste it in Tools > Options > Notifications and enable "Push notification" in the indicator inputs.
8. FAQ
Is it really free? Yes, no subscription and no payments.
Does it repaint? No. Signals are calculated on closed candles and do not change afterwards.
Where does it work? Forex, gold, indices, crypto and synthetic indices, on any timeframe. M15 and H1 work very well for day trading.
Download it for free and leave a review
Download Trading Tendencial for free
If the indicator helps you, please leave a review on the product page. It takes one minute and helps me keep making free tools. If you have questions or ideas, write them in the comments and I will answer.
Check my other tools: https://www.mql5.com/en/users/saintseiyarez-gmail/seller