Young Ho Seo / Profile
- Information
|
10+ years
experience
|
62
products
|
1180
demo versions
|
|
4
jobs
|
0
signals
|
0
subscribers
|
Harmonic Pattern Indicator - Repainting + Japanese Candlestick Pattern Scanner + Automatic Channel + Many more
https://www.mql5.com/en/market/product/4488
https://www.mql5.com/en/market/product/4475
https://algotrading-investment.com/portfolio-item/harmonic-pattern-plus/
Non Repainting and Non Lagging Harmonic Pattern Indicator – Customizable Harmonic + Japanese Candlestic Pattern Scanner + Advanced Channel + Many more
https://www.mql5.com/en/market/product/41993
https://www.mql5.com/en/market/product/41992
https://algotrading-investment.com/portfolio-item/profitable-pattern-scanner/
Supply Demand Indicator – Multiple Timeframe Scanning Added + Non Repainting + Professional Indicator
https://www.mql5.com/en/market/product/40076
https://www.mql5.com/en/market/product/40075
https://algotrading-investment.com/portfolio-item/ace-supply-demand-zone/
Momentum Indicator – Path to Volume Spread Analysis
https://www.mql5.com/en/market/product/30641
https://www.mql5.com/en/market/product/30621
https://algotrading-investment.com/portfolio-item/excessive-momentum-indicator/
Elliott Wave Indicator for the Power User
https://www.mql5.com/en/market/product/16479
https://www.mql5.com/en/market/product/16472
https://algotrading-investment.com/portfolio-item/elliott-wave-trend/
Forex Prediction - Turn Support and Resistance to the Advanced Strategy
https://www.mql5.com/en/market/product/49170
https://www.mql5.com/en/market/product/49169
https://algotrading-investment.com/portfolio-item/fractal-pattern-scanner/
MetaTrader 4 and MetaTrader 5 Product Page: https://www.mql5.com/en/users/financeengineer/seller#products
Free Forex Prediction with Fibonacci Analysis: https://algotrading-investment.com/2020/10/23/forex-prediction-with-fibonacci-analysis/
Free Harmonic Pattern Signal: https://algotrading-investment.com/2020/12/17/harmonic-pattern-signal-for-forex-market/
============================================================================================================================
Here are the trading education books. We recommend reading these books if you are a trader or investor in Forex and Stock market. In the list below, we put the easy to read book on top. Try to read the easy to read book first and try to read the harder book later to improve your trading and investment.
First Link = amazon.com, Second Link = Google Play Books, Third Link = algotrading-investment.com, Fourth Link = Google Books
Technical Analysis in Forex and Stock Market (Supply Demand Analysis and Support Resistance)
https://www.amazon.com/dp/B09L55ZK4Z
https://play.google.com/store/books/details?id=pHlMEAAAQBAJ
https://algotrading-investment.com/portfolio-item/technical-analysis-in-forex-and-stock-market/
https://books.google.co.kr/books/about?id=pHlMEAAAQBAJ
Science Of Support, Resistance, Fibonacci Analysis, Harmonic Pattern, Elliott Wave and X3 Chart Pattern (In Forex and Stock Market Trading)
https://www.amazon.com/dp/B0993WZGZD
https://play.google.com/store/books/details?id=MME3EAAAQBAJ
https://algotrading-investment.com/portfolio-item/science-of-support-resistance-fibonacci-analysis-harmonic-pattern/
https://books.google.co.kr/books/about?id=MME3EAAAQBAJ
Profitable Chart Patterns in Forex and Stock Market (Fibonacci Analysis, Harmonic Pattern, Elliott Wave, and X3 Chart Pattern)
https://www.amazon.com/dp/B0B2KZH87K
https://play.google.com/store/books/details?id=7KrQDwAAQBAJ
https://algotrading-investment.com/portfolio-item/profitable-chart-patterns-in-forex-and-stock-market/
https://books.google.com/books/about?id=7KrQDwAAQBAJ
Guide to Precision Harmonic Pattern Trading (Mastering Turning Point Strategy for Financial Trading)
https://www.amazon.com/dp/B01MRI5LY6
https://play.google.com/store/books/details?id=8SbMDwAAQBAJ
http://algotrading-investment.com/portfolio-item/guide-precision-harmonic-pattern-trading/
https://books.google.com/books/about?id=8SbMDwAAQBAJ
Scientific Guide to Price Action and Pattern Trading (Wisdom of Trend, Cycle, and Fractal Wave)
https://www.amazon.com/dp/B073T3ZMBR
https://play.google.com/store/books/details?id=5prUDwAAQBAJ
https://algotrading-investment.com/portfolio-item/scientific-guide-to-price-action-and-pattern-trading/
https://books.google.com/books/about?id=5prUDwAAQBAJ
Predicting Forex and Stock Market with Fractal Pattern: Science of Price and Time
https://www.amazon.com/dp/B086YKM8BW
https://play.google.com/store/books/details?id=VJjiDwAAQBAJ
https://algotrading-investment.com/portfolio-item/predicting-forex-and-stock-market-with-fractal-pattern/
https://books.google.com/books/about?id=VJjiDwAAQBAJ
Trading Education Book 1 in Korean (Apple, Google Play Book, Google Book, Scribd, Kobo)
https://books.apple.com/us/book/id1565534211
https://play.google.com/store/books/details?id=HTgqEAAAQBAJ
https://books.google.co.kr/books/about?id=HTgqEAAAQBAJ
https://www.scribd.com/book/505583892
https://www.kobo.com/ww/en/ebook/8J-Eg58EDzKwlpUmADdp2g
Trading Education Book 2 in Korean (Apple, Google Play Book, Google Book, Scribd, Kobo)
https://books.apple.com/us/book/id1597112108
https://play.google.com/store/books/details?id=shRQEAAAQBAJ
https://books.google.co.kr/books/about?id=shRQEAAAQBAJ
https://www.scribd.com/book/542068528
https://www.kobo.com/ww/en/ebook/X8SmJdYCtDasOfQ1LQpCtg
About Young Ho Seo
Young Ho Seo is an Engineer, Financial Trader, and Quantitative Developer, working on Trading Science and Investment Engineering since 2011. He is the creator of many technical indicators, price patterns and trading strategies used in the financial market. He is also teaching the trading practice on how to use the Supply Demand Analysis, Support, Resistance, Trend line, Fibonacci Analysis, Harmonic Pattern, Elliott Wave Theory, Chart Patterns, and Probability for Forex and Stock Market. His works include developing scientific trading principle and mathematical algorithm in the work of Benjamin Graham, Everette S. Gardner, Benoit Mandelbrot, Ralph Nelson Elliott, Harold M. Gartley, Richard Shabacker, William Delbert Gann, Richard Wyckoff and Richard Dennis. You can find his dedicated works on www.algotrading-investment.com . His life mission is to connect financial traders and scientific community for better understanding of this world and crowd behaviour in the financial market. He wrote many books and articles, which are helpful for understanding the technology and application behind technical analysis, statistics, time series forecasting, fractal science, econometrics, and artificial intelligence in the financial market.
If you are interested in our software and training, just visit our main website: www.algotrading-investment.com
Young Ho Seo
Using Spread Chart from the Pairs Trading Station in MetaTrader
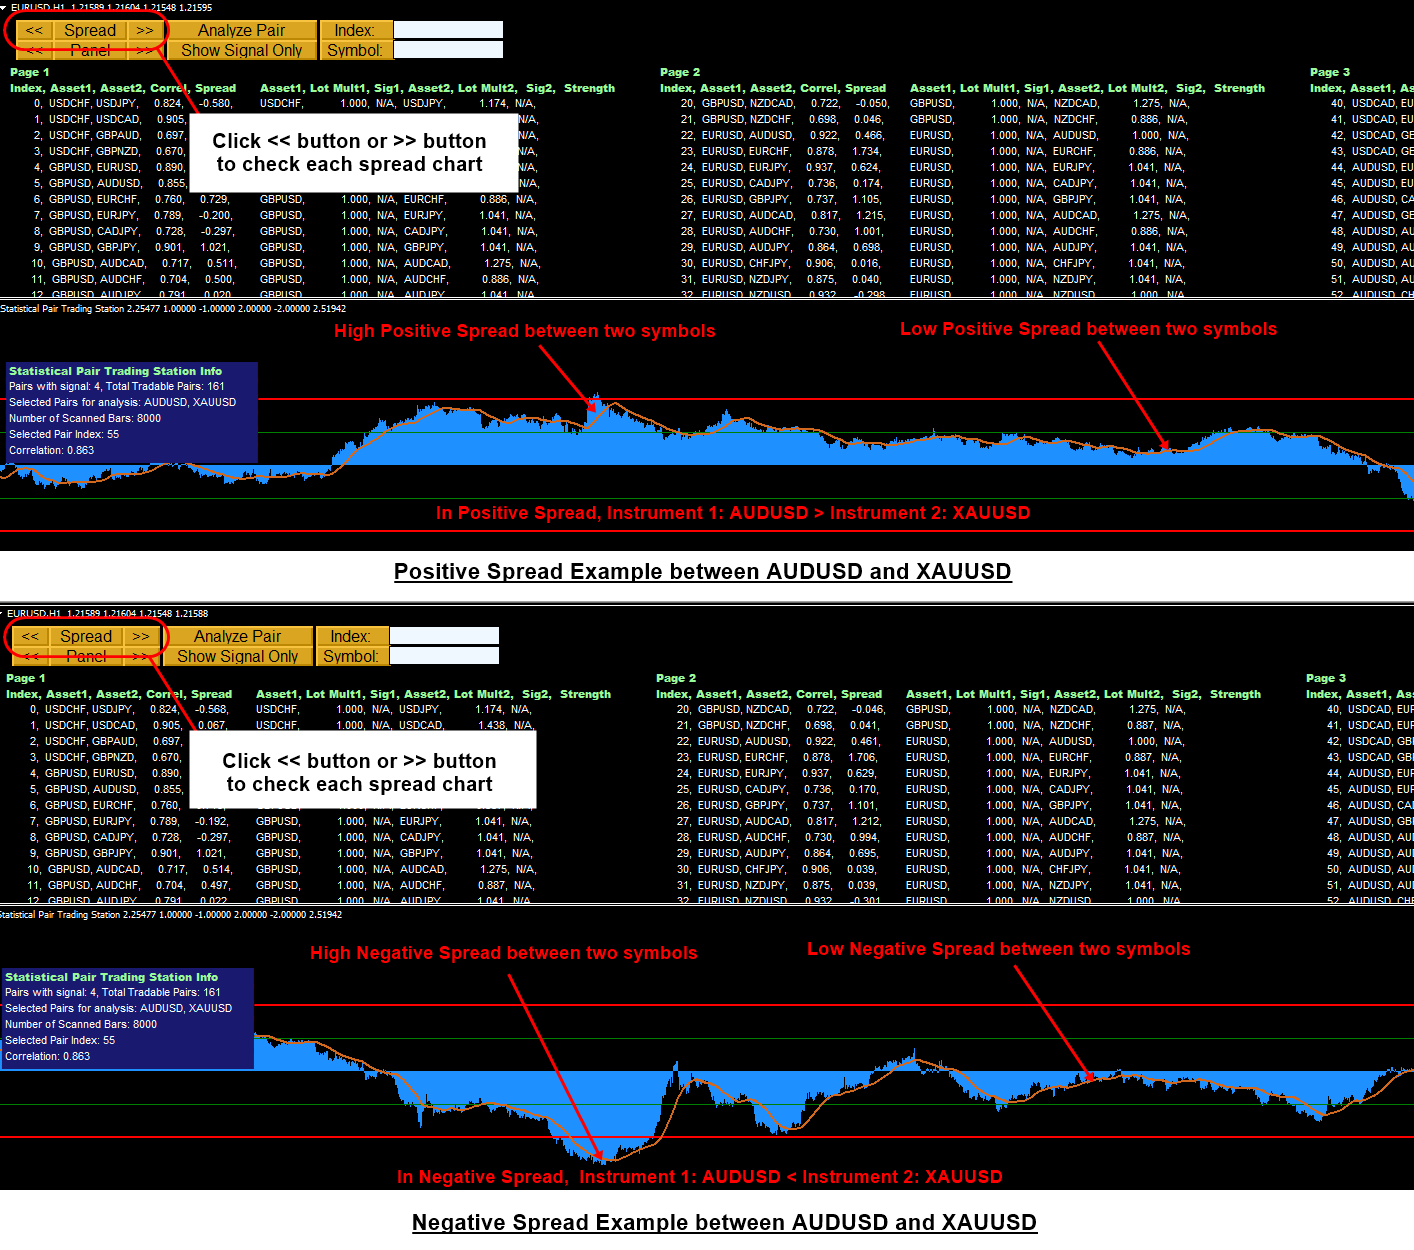
From Pairs Trading Station in MetaTrader version, you can access the Spread Chart, which is mathematically processed to show the distance between two financial instruments (or between two assets).
You can access the Spread Chart by clicking << button or >> button near the Spread button.
Here is the brief guide on how to interpret the Spread Chart. In this example, we use AUDUSD and XAUUSD as asset 1 and asset 2. The absolute magnitude of these two assets are compared in the normalized sense to compare apple to apple and pear to pear. Two cases exist including the positive spread and negative spread.
In positive spread, AUDUSD (i.e. asset 1) is greater than XAUUSD (i.e. asset 2). Higher the positive spread means that AUDUSD is much greater than XAUUSD in the normalized sense. If the positive spread is small, then the difference between AUDUSD and XAUUSD is also small.
In negative spread, AUDUSD (i.e. asset 2) is smaller than XAUUSD (i.e. asset 2). Higher the negative spread means that AUDUSD is much smaller than XAUUSD in the normalized sense. If the negative spread is small, then the difference between AUDUSD and XAUUSD is also small.
Further you can access more detailed trading operation with below Pairs Trading Manual.
https://algotrading-investment.com/2015/11/14/introduction-to-pair-trading-station_ati/
In addition, you can watch this YouTube Video titled as How to use Pairs Trading Station
https://youtu.be/fAE9pByxZDA
To help you understand the spread chart, we also attach the screenshot.
Pair Trading Station is very unique trading system based on Statistical Arbritage trading principle. Below is the direct link to Pair Trading Station for MetaTrader 4 and MetaTrader 5 platform:
https://algotrading-investment.com/portfolio-item/pair-trading-station/
https://www.mql5.com/en/market/product/3303
https://www.mql5.com/en/market/product/3304
So far, we have explained the functionality of Pairs Trading Station in MetaTrader version, covering both MetaTrader 4 and MetaTrader 5. In addition, we also provide the Pairs Trading Station in Optimum Chart too with more advanced features.
https://algotrading-investment.com/2019/07/23/optimum-chart/

Young Ho Seo
Powerful Non Repainting Supply Demand Zone MetaTrader Indicator
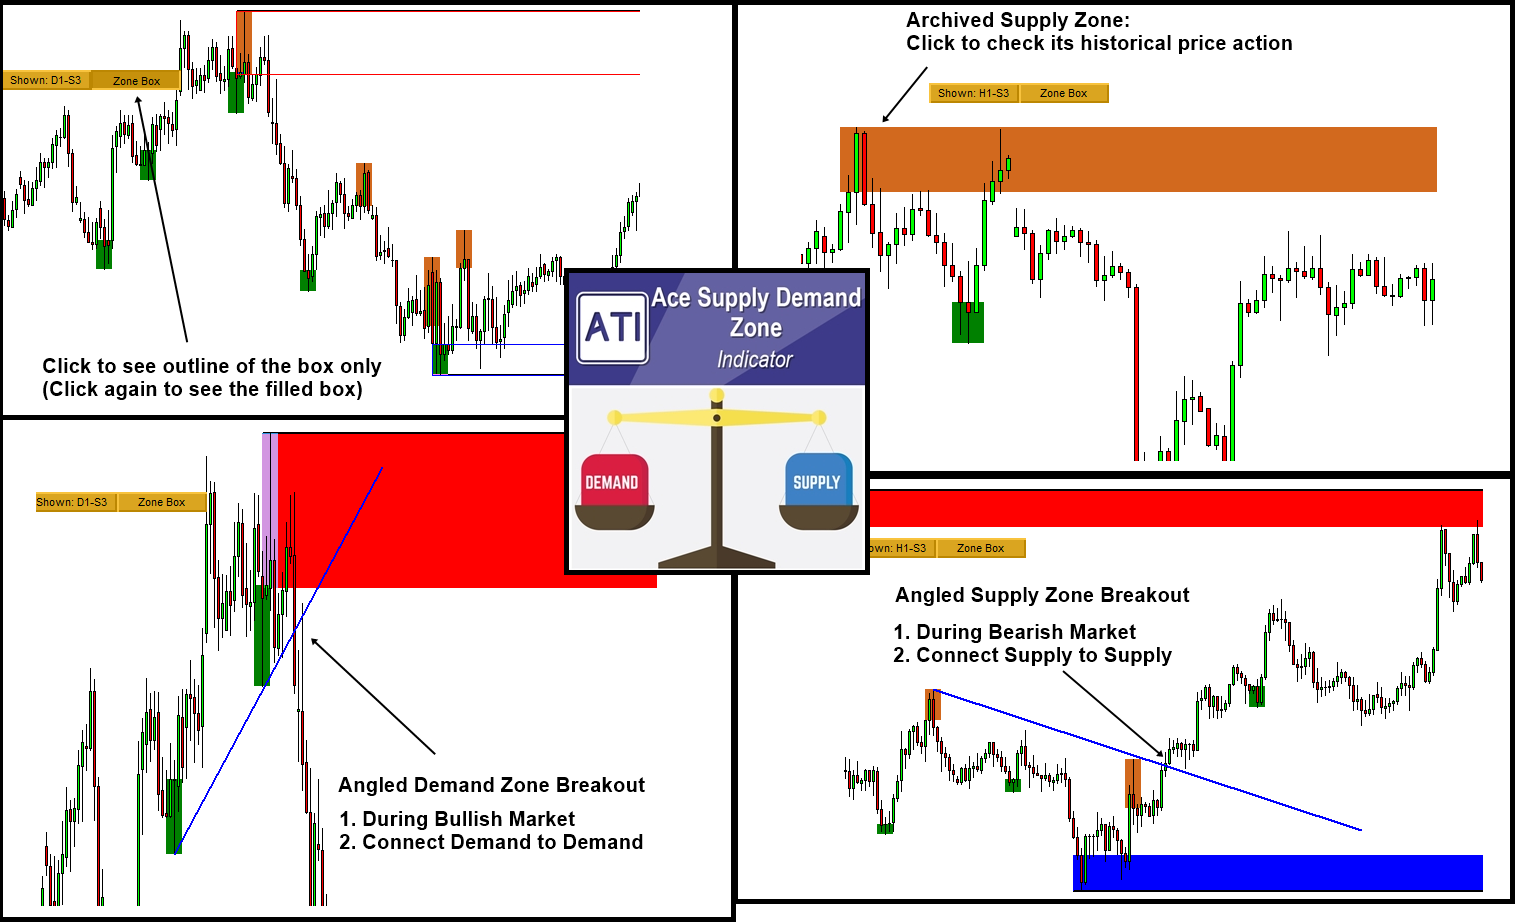
Ace Supply Demand Zone is specially designed non-repainting Supply Demand indicator. Since you have an access to fresh supply and demand zone as well as archived supply demand zone, you can achieve much better profiling on price movement in Forex market.
With the Ability to trade the original supply demand zone trading, you can also perform highly accurate Angled Supply Demand zone trading as a bonus. With a lot of sophisticated gadgets built inside, Ace Supply Demand Zone indicator will provide you unmatched performance against other Supply Demand zone indicator out there.
Here is the link to Ace Supply Demand Zone Indicator.
https://www.mql5.com/en/market/product/40076
https://www.mql5.com/en/market/product/40075
https://algotrading-investment.com/portfolio-item/ace-supply-demand-zone/
In addition, we provide the YouTube video for Ace Supply Demand Zone Indicator. In terms of indicator operation, both mean reversion supply demand and ace supply demand zone indicator are similar. Hence, you can watch this YouTube Video to accomplish the supply demand zone indicator.
YouTube “Supply Demand Zone Indicator”: https://youtu.be/lr0dthrU9jo

Young Ho Seo
Elliott Wave Indicator YouTube Video
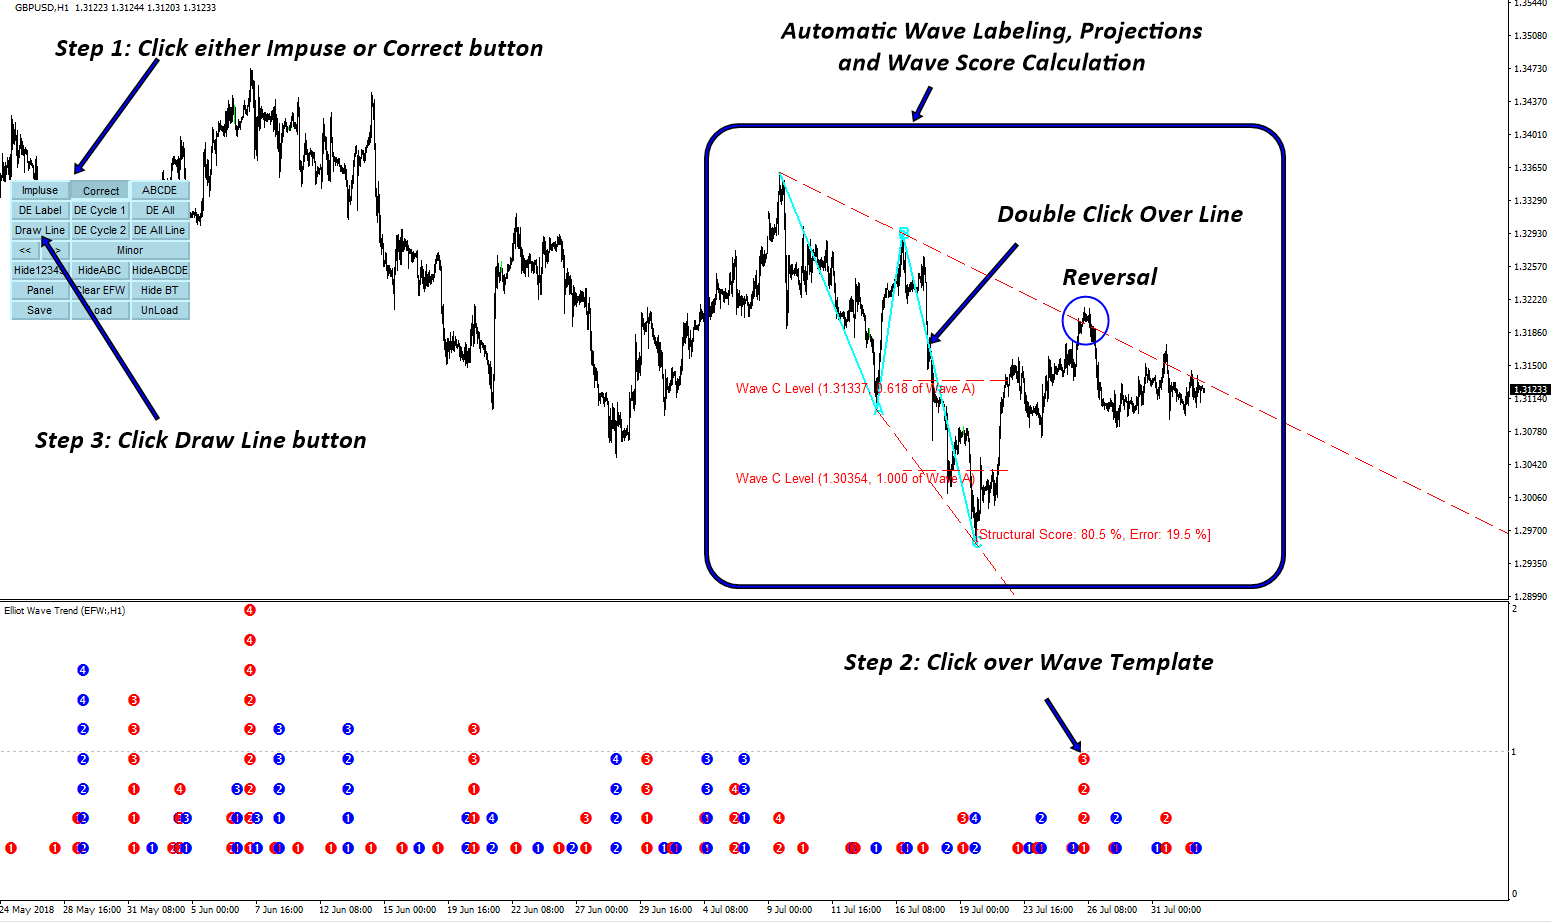
Elliott Wave could be complex trading solution in its original form. For example, identifying motive wave and corrective wave in chart can be hard in general. However, it can be simplified with Pattern and Template approach typically used in Artificial intelligence and data mining approach. Based on this idea, we have created a powerful Elliott Wave indicator.
This YouTube video can help you to understand how Elliott Wave indicator can help you with your trading with the implemented Pattern and Template Approach. Check out the video link below.
YouTube Video: https://www.youtube.com/watch?v=Oftml-JKyKM
Here is an article you can read in addition to the YouTube video.
https://algotrading-investment.com/2018/10/25/how-elliott-wave-can-improve-your-trading-performance/
Our Elliott Wave Trend is available in both MetaTrader 4 and MetaTrader 5 version.
https://algotrading-investment.com/portfolio-item/elliott-wave-trend/
https://www.mql5.com/en/market/product/16472
https://www.mql5.com/en/market/product/16479

Young Ho Seo
Winning Trading Logic – Detecting Supply and Demand Unbalance
As we have pointed out in our article, detecting the supply and demand unbalance is the most important key in making profits in Financial market. The excessive momentum indicator is the automated tool to detect these unbalance in supply and demand for your trading. With excessive momentum drawn in your chart, it is much easier to predict the timing of new trend and its direction.
Here is the insightful article explaining where the profits comes and how the profits are captured with the knowledge of excessive momentum. If you really want to make money in the market, must read this article. Reading does not cost you anything.
https://algotrading-investment.com/2018/10/29/introduction-to-excessive-momentum-trading/
This Excessive Momentum Zone can be considered as either Accumulation or Distribution area in the Volume Spread Analysis. You can further find the symptoms of accumulation and distribution area using our Volume Spread Pattern Indicator (Paid and Advanced version) or Volume Spread Pattern Detector (Free and Light version). You can watch the YouTube videos to find more about the Excessive Momentum Indicator.
YouTube Video Momentum Indicator: https://youtu.be/oztARcXsAVA
Here is link to Excessive Momentum Indicator available on MetaTrader 4 and MetaTrader 5 platform.
https://algotrading-investment.com/portfolio-item/excessive-momentum-indicator/
https://www.mql5.com/en/market/product/30641
https://www.mql5.com/en/market/product/30621
Young Ho Seo
Mean Reversion Supply Demand Basic Guideline
Supply and Demand zone is the extended version of support and resistance trading with more skills. We provide our own Supply and Demand Zone indicator, Mean Reversion Supply Demand.
Here is the really basic guideline in using Mean Reversion Supply Demand.
H4 = Zone detected in H4 timeframe
S3 = Zone Strength 3
You can also show or hide zones from your chart using button click.
Below are the links to the Mean Reversion Supply Demand indicator for MetaTrader 4/MetaTrader 5.
https://www.mql5.com/en/market/product/16823
https://www.mql5.com/en/market/product/16851
https://algotrading-investment.com/portfolio-item/mean-reversion-supply-demand/

Young Ho Seo
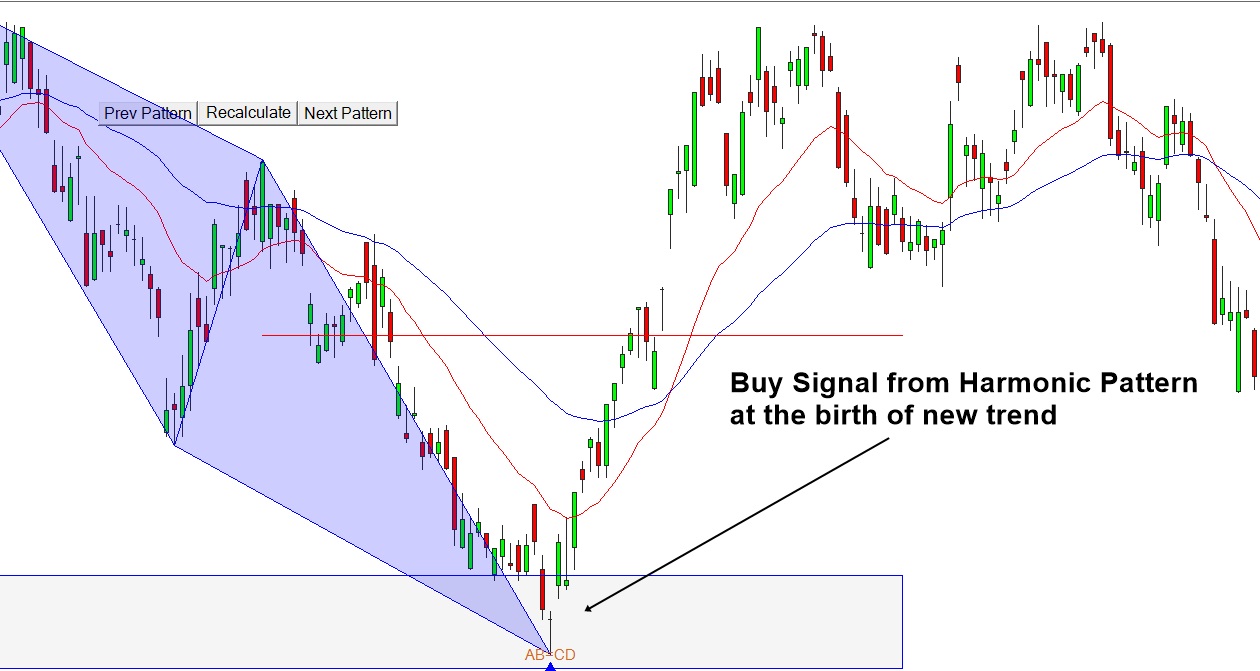
Harmonic Pattern – Turning Point and Trend
This article “Turning Point and Trend” tries to answer you on when to use Harmonic Pattern Trading in terms of the four market cycle including Birth, Growth, Maturity and Death. If you want to become profitable trader, then you need to decide when your capital to dive into the market. The best way is doing it with the market rhythm, i.e. the market cycle. This article will provide you the clear answer on how to tune your entry with the market. This is the first step for any trader in choosing their strategy in fact. You would also revise the pros and cons of the turning point strategy, semi turning point strategy and trend strategy.
https://algotrading-investment.com/2019/07/06/turning-point-and-trend/
Below are the list of automated Harmonic pattern Indicator developed for MetaTrader 4 and MetaTrader 5 platform.
Harmonic Pattern Plus
One of the first automated Harmonic Pattern detection tool released in 2014. It can detect 11 most popular harmonic patterns with well-defined trading entries and stops. Pattern Completion Interval, Potential Reversal Zone and Potential Continuation Zone are supported. In addition, other dozens of powerful features are added like Japanese candlestick detection, etc. Because of affordable price, this harmonic pattern detection indicator is loved by many traders. Please note that this is repainting and non lagging harmonic pattern trading system.
https://www.mql5.com/en/market/product/4488
https://www.mql5.com/en/market/product/4475
https://algotrading-investment.com/portfolio-item/harmonic-pattern-plus/
Harmonic Pattern Scenario planner
It is an advanced Harmonic Pattern indicator. On top of the features of Harmonic Pattern Plus, you can also predict future harmonic patterns through simulation. This is the tactical harmonic pattern tool designed for Professional harmonic pattern trader. Because of affordable price, this harmonic pattern detection indicator is loved by many traders. Please note that this is repainting and non lagging harmonic pattern trading system.
https://www.mql5.com/en/market/product/6240
https://www.mql5.com/en/market/product/6101
https://algotrading-investment.com/portfolio-item/harmonic-pattern-scenario-planner/
Both Harmonic pattern plus and Harmonic Pattern Scenario planner are the excellent trading system at affordable cost. However, if you do not like repainting Harmonic pattern indicator, then we also provide the non repainting and non lagging harmonic pattern trading. Just check the X3 Chart Pattern Scanner below.
Link to X3 Chart Pattern Scanner
https://www.mql5.com/en/market/product/41993
https://www.mql5.com/en/market/product/41992
https://algotrading-investment.com/portfolio-item/profitable-pattern-scanner/

Young Ho Seo
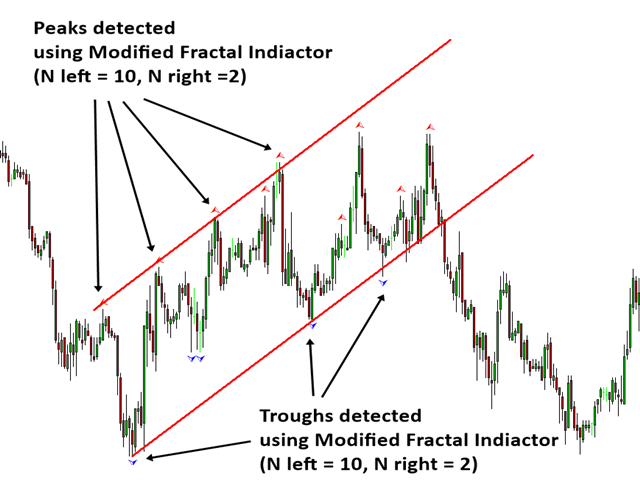
Peak Trough Analysis
We have released Peak Trough Analysis tool on 2017 nearly at the same time we were writing on the book: Scientific Guide to Price Action and Pattern Trading (Wisdom of Trend, Cycle, and Fractal Wave). It was because peak trough analysis helps you a lot of price action and pattern trading. If know the principle, there is not doubt that this peak trough analysis tool is very powerful for your trading.
Here is the download link for the free Peak Trough Analysis Tool for MetaTrader 4 and MetaTrader 5.
https://www.mql5.com/en/market/product/23797
https://www.mql5.com/en/market/product/22420
https://algotrading-investment.com/portfolio-item/peak-trough-analysis-tool/
If you can understand how peak trough analysis works for your trading. You can use peak trough analysis together with either Advanced Price Pattern Scanner or Price Breakout Pattern Scanner to yield better profits. Both tools are great to be used together with above free peak trough analysis tools. Hence, we share the link for both.
Below are the links to Advanced Price Pattern Scanner.
https://www.mql5.com/en/market/product/24679
https://www.mql5.com/en/market/product/24678
https://algotrading-investment.com/portfolio-item/advanced-price-pattern-scanner/
Below are the links to Price breakout Pattern Scanner
https://www.mql5.com/en/market/product/4859
https://www.mql5.com/en/market/product/4858
https://algotrading-investment.com/portfolio-item/price-breakout-pattern-scanner/
You can also use our other product together with Peak Trough Analysis. Here is the entire product list.
https://www.mql5.com/en/users/financeengineer/seller#products
https://algotrading-investment.com/

Young Ho Seo
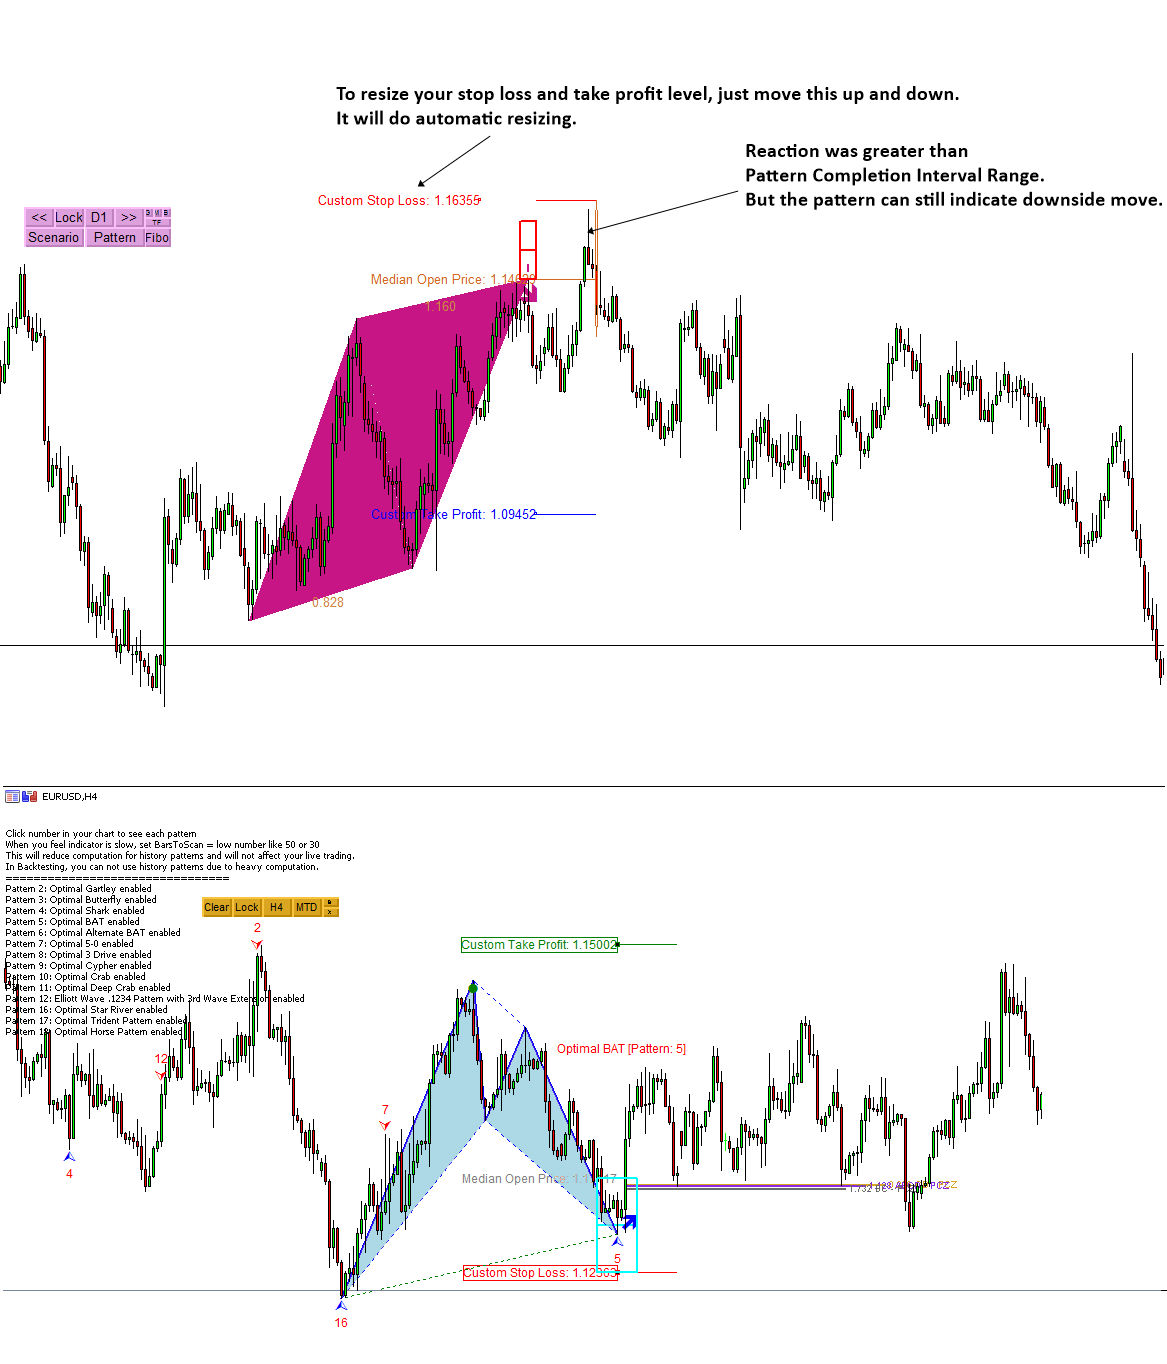
Harmonic Pattern Indicator Video
Here is some videos on Harmonic Pattern Indicator on Youtube that shows the some features of Harmonic Pattern Automatic Scanner.
The video explains stop loss, take profit and Potential Continuation zone (PCZ), Potential Reversal Zone (PRZ), Pattern Completion Interval (PCI), etc for Harmonic Pattern Plus (also applicable to Harmonic Pattern Scenario Planner)
YouTube: https://www.youtube.com/watch?v=CzYUwk5qeCk
Here is a video tutorial on X3 Chart Pattern Scanner on YouTube. This video will provide a brief guide on X3 Chart Pattern Scanner.
YouTube: https://www.youtube.com/watch?v=uMlmMquefGQ
For your information, above videos are bit old now. This means that both harmonic pattern plus and X3 chart pattern scanner has a lot more features added after the creation of the video. However, the video is still good to show you some basic features of both Harmonic Pattern Indicator. Simpley visit our website for both of them.
https://www.mql5.com/en/users/financeengineer/seller
https://algotrading-investment.com/

Young Ho Seo
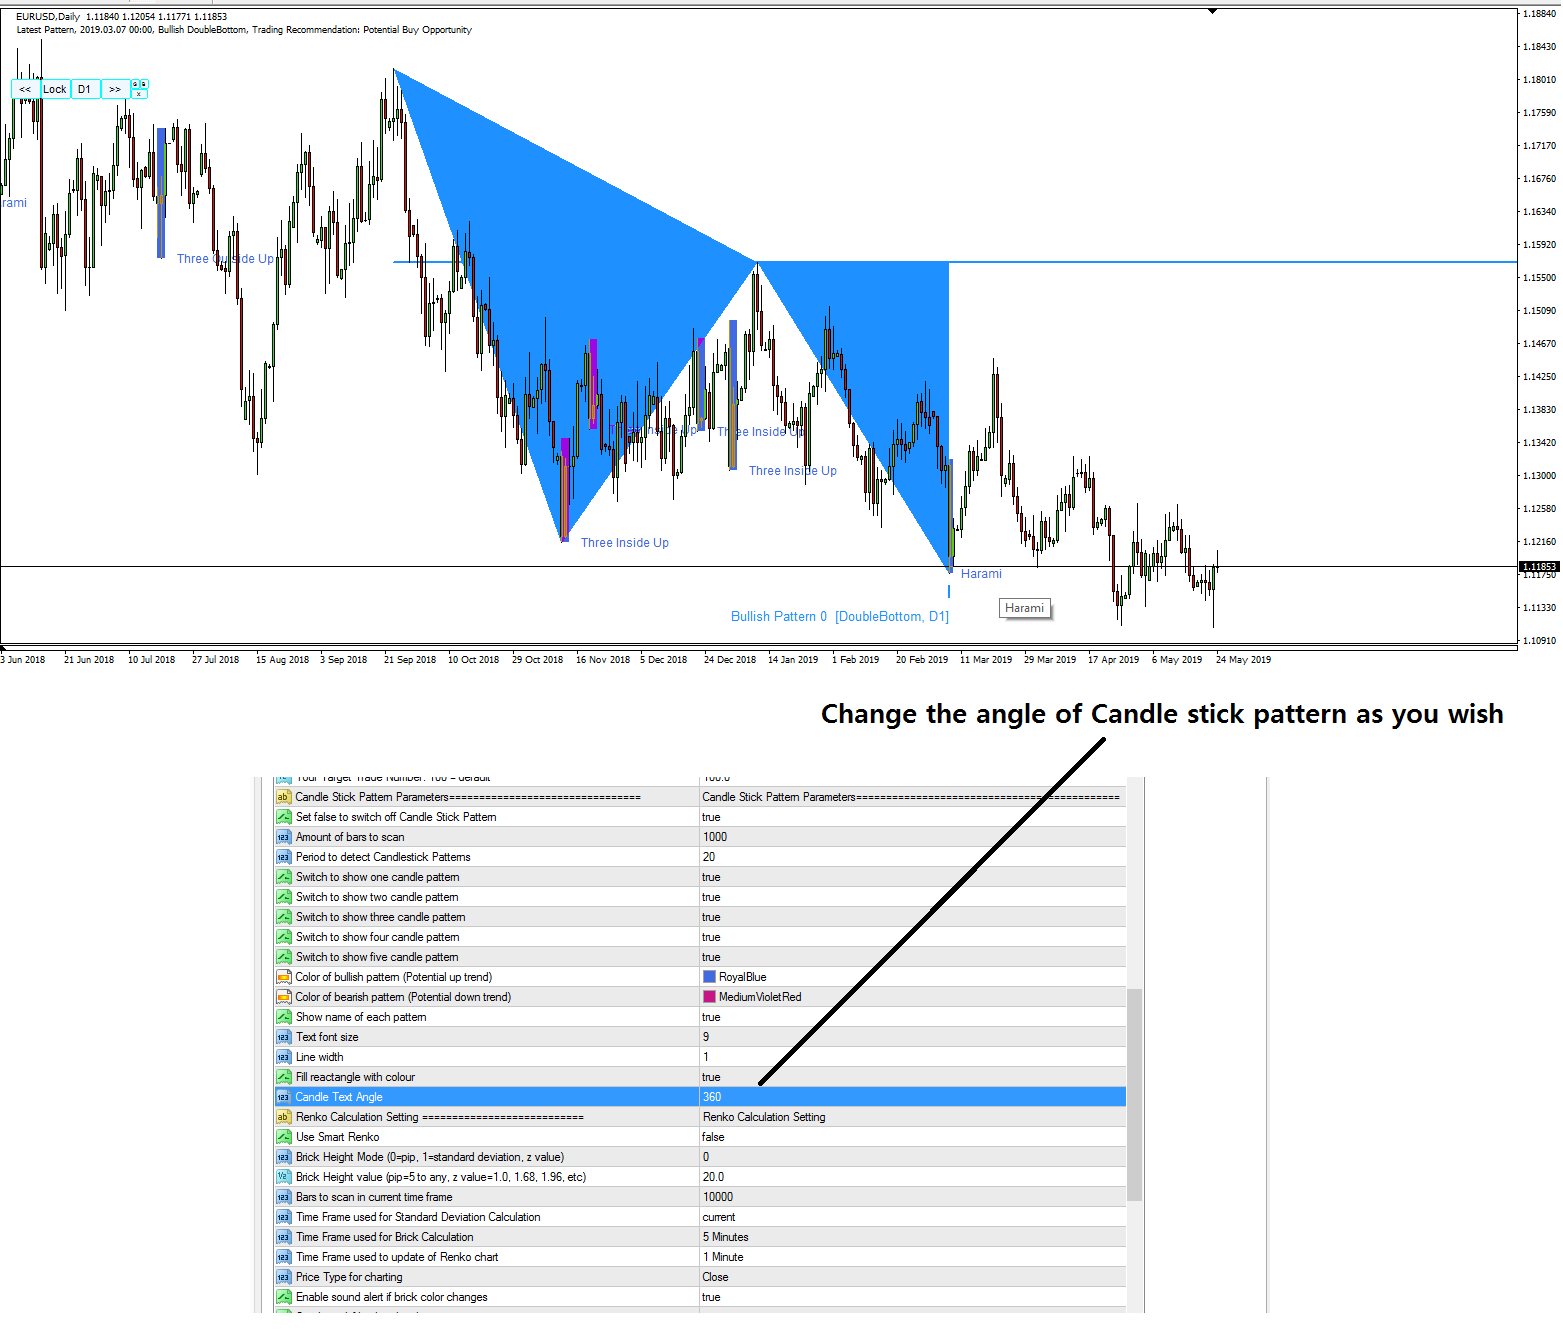
Japanese CandleStick Pattern in Price Pattern Scanner
Japanese candle stick patterns are built in feature inside Price Breakout Pattern Scanner. This is kind of bonus feature for customers who are buying our Price Breakout Pattern Scanner.
In Japanese candlestick inputs, you can switch on and off Candlestick pattern according to their type. For example, there are Japanese candlestick pattern made up from one candle bar, two candle bar, three candle bar, etc. You can switch on and off each according to your preference.
As a default setting, Pattern Name will be printed in chart. At the same time, you can bring your mouse over to each Japanese candlestick pattern to float pattern name in tool tip box (MT5 is more responsive than MT4 for this tool tip box) Alternatively, you can also change the angle of pattern name from horizontal to vertical or vice versa depending on your readability. In addition, we provide the YouTube Video for Price Breakout Pattern Scanner. With the video, you can see some basic operation of the price breakout pattern scanner. This video is applicable to both MetaTrader 4 and MetaTrader 5 platforms.
YouTube Video “How To Use Price Breakout Pattern Scanner”: https://www.youtube.com/watch?v=aKeSmi_Di2s
Download the latest version for the maximum performance and more profits.
https://www.mql5.com/en/market/product/4859
https://www.mql5.com/en/market/product/4858
https://algotrading-investment.com/portfolio-item/price-breakout-pattern-scanner/

Young Ho Seo
How to Ride the Price Swing or Fractal Wave in Forex – Must Read
In this short article, we will share some practical tips to ride the price swings (or Fractal wave) in Forex and Stock market. Please read this article for your own good as it does not cost you anything. Forex trading is basically the decision making process over the market entry and exit. The most important variable you need to watch is the price. You need to watch how the price evolves with time. Hence, we will share the best way to calculate the market timing.
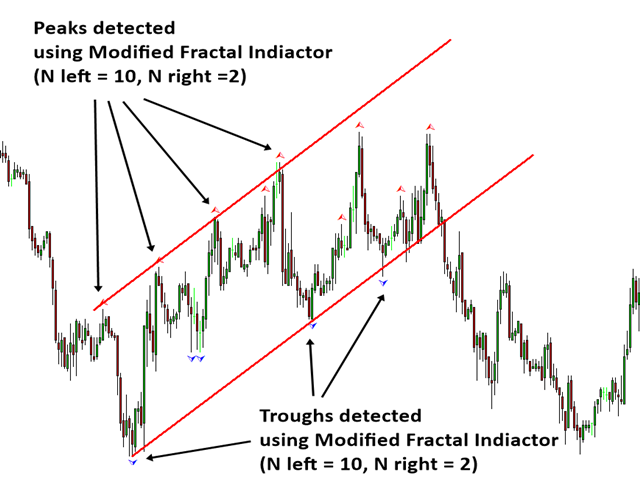
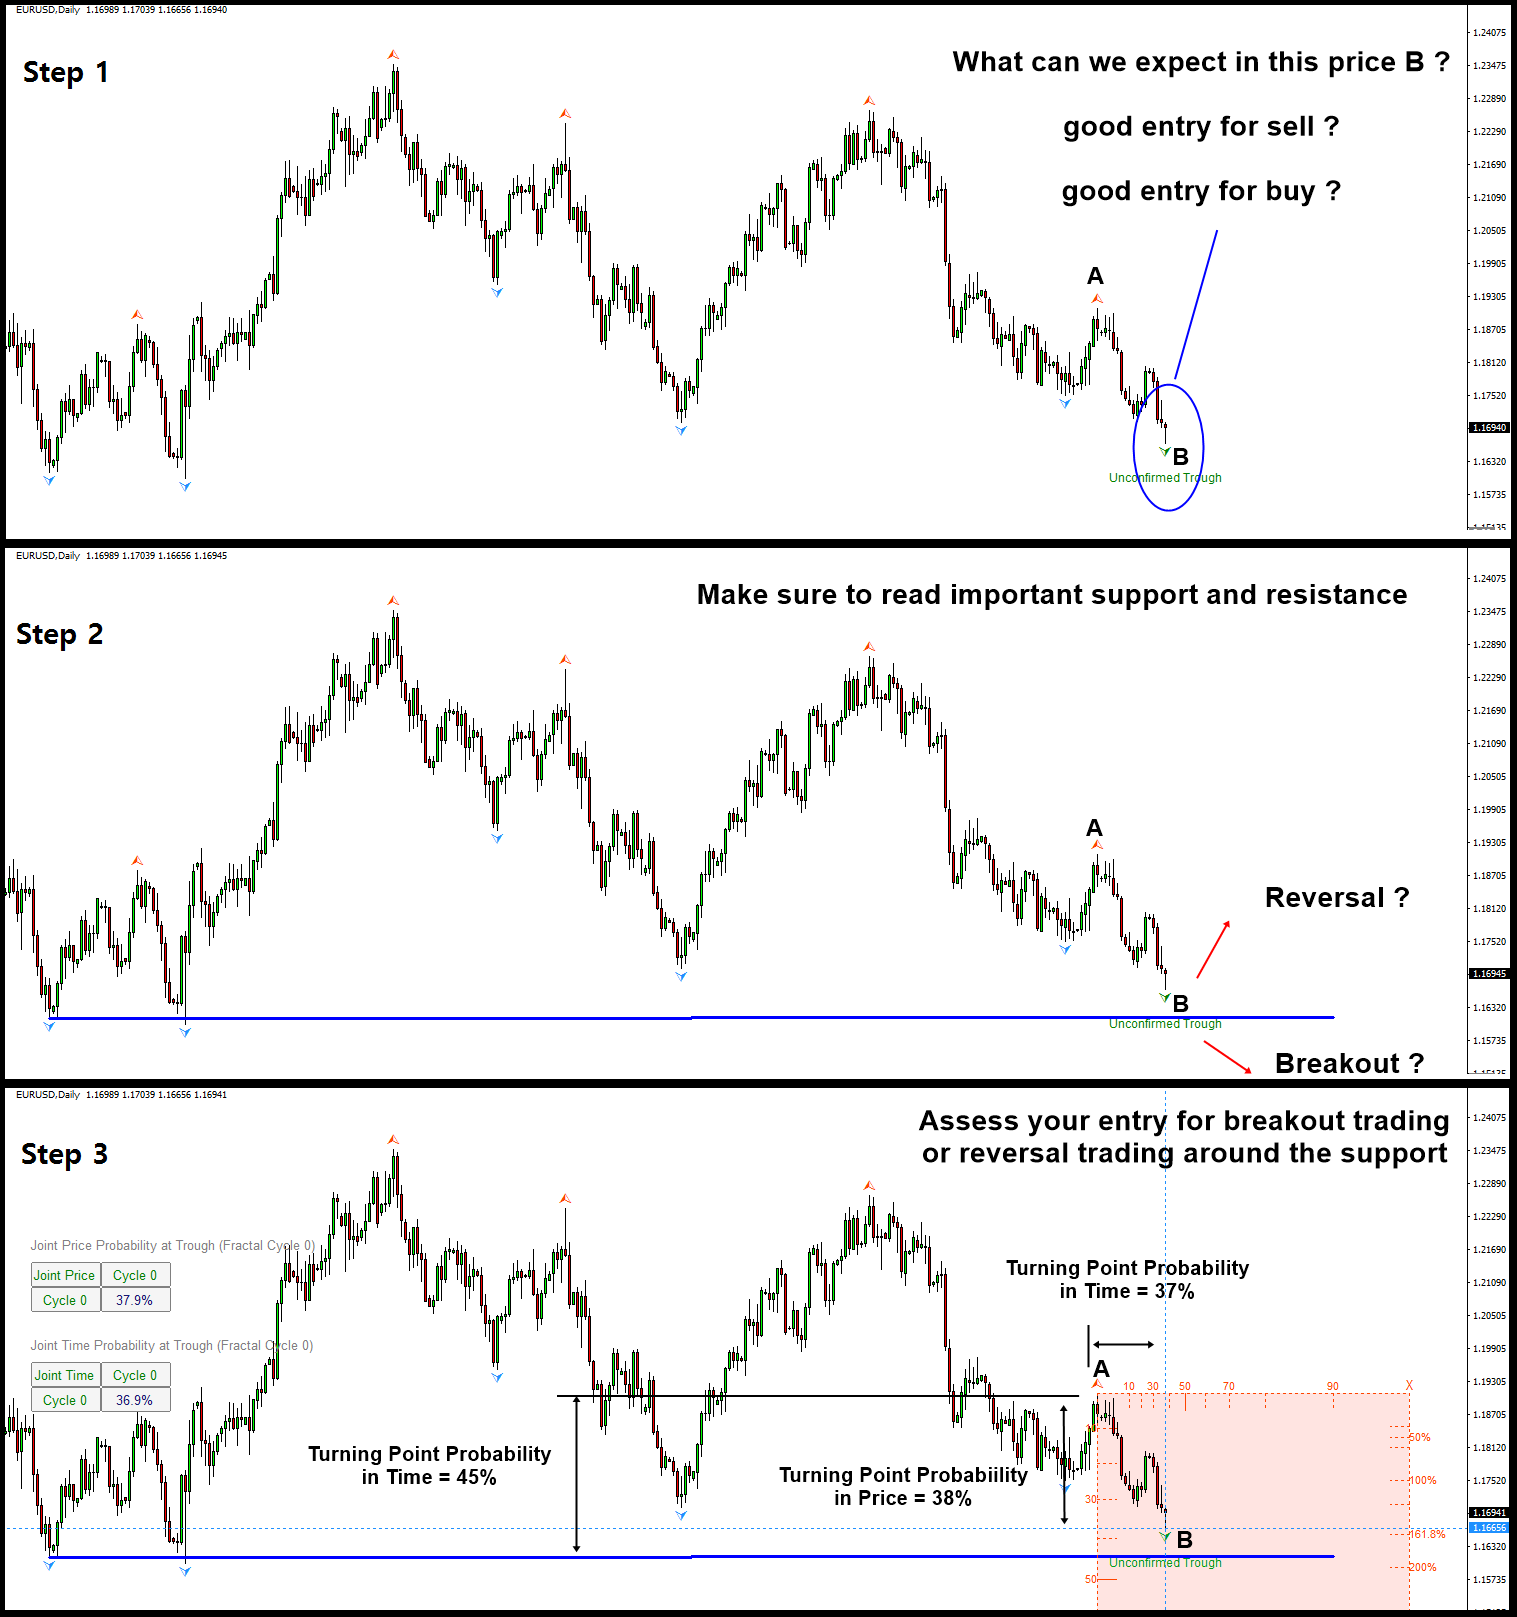
Step 1: open the chart. This is the first requirement for any trading. You need to see the price to learn what is going on in the market. Especially, when you apply the peak trough analysis in your chart, you will see lowest and highest points marked automatically. This lowest and highest points are basically the price swings happened in the past. You need use these price swings to read the market rhythm before making your trading decision.
Step 2: Look for the important horizontal support and resistance or diagonal support and resistance. In this example, we have drawn the horizontal support line for the visual illustration of this process. Marking up the support and resistance is simple task with peak trough analysis in your chart. Never underestimated them. It can takes as little time as 2 to 3 minutes to draw one or two important lines.
Step 3: Here is the most important part. As in our example, the price is heading to the horizontal support line, we need to assess how risky to take the reversal or breakout trading around this horizontal support line. Now we apply our turning point probability graph to assess our opportunity for reversal or breakout. Turning point probability will be measured between the point A and the point B. That is one price swing or fractal wave. Now let us have a look at the number.
From the turning point probability graph, at the point B, we can tell the followings:
the turning point probability in price is 38%
turning point probability in time is 37%
In another words, at the point B, we can tell the followings:
the trend probability in price is 62% (1 – 38%)
trend probability in time is 63% (1 – 37%)
Interpreting this probability, we can tell that the current price level is little bit immature to expect the reversal movement. If price go down further and it touches the horizontal support line, then we can tell the followings:
the turning point probability in price is 45%
turning point probability in time is unknown now. Depending on how fast or slowly price come down, it might go over 50%.
In Step 3 analysis, there are two important points for you to understand. Firstly, this trading opportunity is not entirely favoring the reversal trading. There are some cases which your chance for reversal trading is much higher comparing to the breakout trading chance. The step 3 analysis will usually help you to find out that. Secondly, since the certainty is not too high, this recommends you to position size carefully. In another words, you need to think about the mild position size rather than the big position size. Even more simply speaking, reduce the lot size for your forex trading. Then depending on the surrounding market condition, you can conditionally increase or reduce the position size. Checking the surrounding market condition is the final check up. If the surrounding market condition is not favoring your trading direction, it is good to skip this opportunity.
In long run, we recommend you to follow step 1, step 2 and step 3. Especially, step 3 is the most important analysis as you have the opportunity to access your risk in your trading. Typically, visualizing one’s trading decision is not an easy task. Hence, this article is not meant to provide the exhausted list of the analysis steps but use as only some base guideline. We hope you enjoy this short practical guideline. There are more educational articles in this link below.
https://algotrading-investment.com/2019/07/23/trading-education/
https://algotrading-investment.com/2020/04/26/metatrader-and-optimum-chart-manuals/
For the time being, there are only two tools that can measure the turning point probability in price and time. First one is the Fractal Pattern Scanner for MetaTrader 4 and MetaTrader 5. Second one is the Optimum Chart.
Below is the landing page for Fractal Pattern Scanner in MetaTrader version.
https://www.mql5.com/en/market/product/49170
https://www.mql5.com/en/market/product/49169
https://algotrading-investment.com/portfolio-item/fractal-pattern-scanner/
In addition, to accomplish this article. you can watch this YouTube video titled as “Breakout Trading vs Reversal Trading (Turn Support & Resistance to Killer Strategy)” in this link below to get some hands on practice with breakout and reversal trading opportunity with Support and Resistance Technical Analysis. In another words, you can turn simple support and resistance to the killer strategy for Forex trading.
YouTube Video Link: https://youtu.be/UbORmOacKIQ

Young Ho Seo
Harmonic Pattern Indicator with Japanese Candlestick Pattern
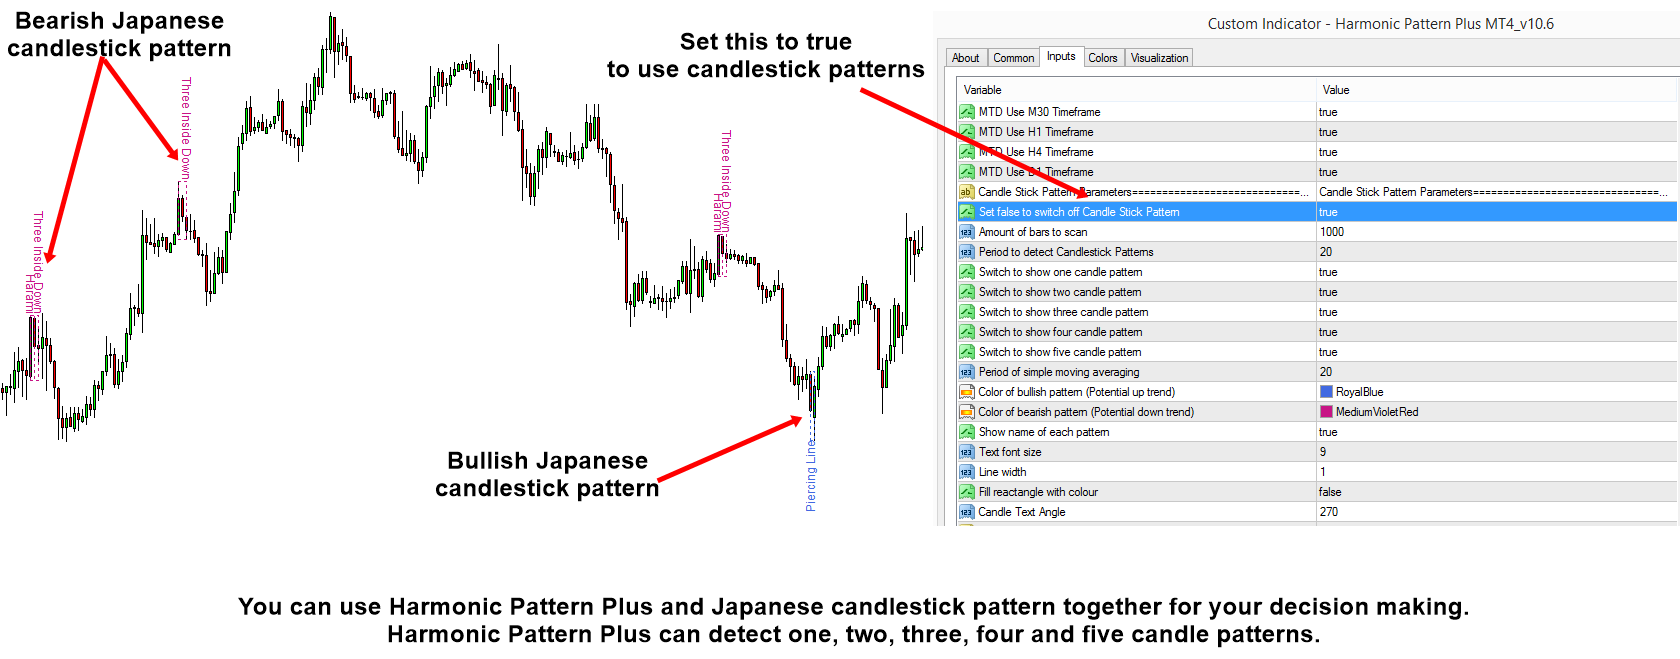
Apparently Japanese Candlestick patterns are popular and helpful tools to trader to predict the market direction. It is possible to use Japanese Candlestick patterns in your Harmonic Pattern Trading. These Japanese candlestick patterns include “Hammer”, “Doji Star”, “Harami”, “Inverted Hammer”, “Break away” and so on.
Here is some short article on how to use Japanese candlestick pattern with Harmonic Pattern Plus. This article meant to be quick guideline on enabling Japanese Candlestick pattern together with Harmonic Pattern. In addition, you can use the Japanese Candlestick Patterns from X3 Chart Pattern Scanner too.
https://algotrading-investment.com/2019/04/19/using-japanese-candlestick-patterns-with-harmonic-pattern-plus/
Link to Harmonic Pattern Plus
https://www.mql5.com/en/market/product/4488
https://www.mql5.com/en/market/product/4475
https://algotrading-investment.com/portfolio-item/harmonic-pattern-plus/
Link to X3 Chart Pattern Scanner
https://www.mql5.com/en/market/product/41993
https://www.mql5.com/en/market/product/41992
https://algotrading-investment.com/portfolio-item/profitable-pattern-scanner/

Young Ho Seo
Price Patterns to Identify the Potential Turning Point and Trend
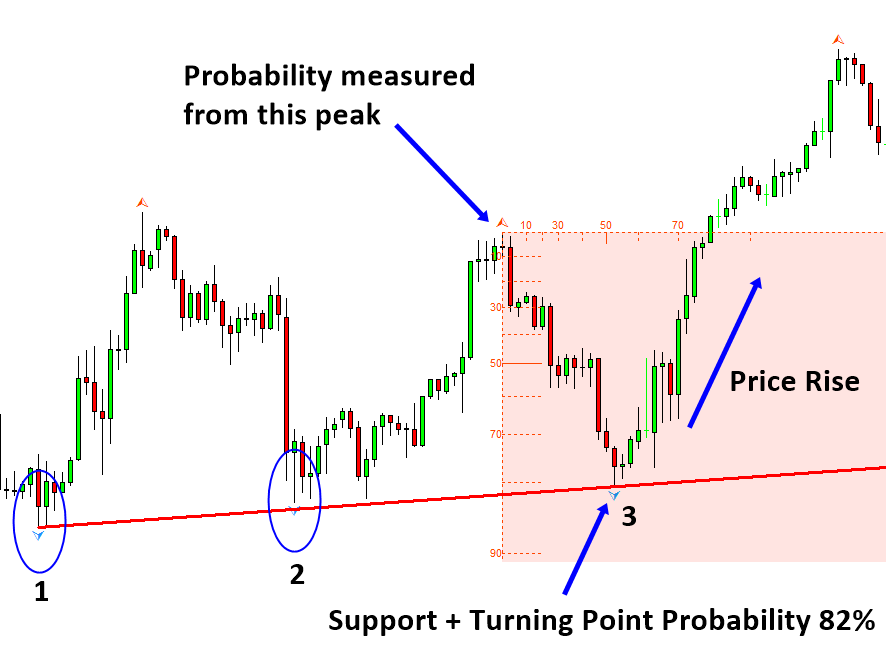
To understand the technical turning point, it is important to check its connection with economics. For example, in Stock market trading, the underlying value of a company can explain the occurrence of the major turning point in the market. Likewise, in the foreign exchange market, the strength and weakness of a currency is often influenced by the fundamental value of a country. The fundamental and economic data release can cause to change the direction of the current price movement. As a result, they often become the major driving force behind the bullish and bearish turning point. Hence, to understand why an important turning point occurs in the financial market, we recommend you to look at following three cases.
Turning point in the Stock market with “Value investing”
Turning point in the Forex market with “Fundamental analysis”
Pairs Trading with turning point
When you understand the driving force of the turning point in connection with economics, it helps you to follow the flow of the smart money from the investment banks and hedge funds. Besides, the price pattern can also help you to predict the turning point technically. When you apply the price pattern together with the knowledge of the fundamental driving force of the turning point, you can increase your performance marginally. Therefore, it is important to understand the price patterns used by the trading community last 100 years. We list the important price patterns for your technical analysis below.
Horizontal support and resistance
Diagonal support and resistance (i.e. trend lines)
Triangles and wedge patterns
Fibonacci analysis
Harmonic pattern
Elliott wave theory
X3 Chart Pattern
To apply these price patterns better in practice, we must understand the origin of these price patterns with the scientific view. Fractal and fractal wave can explain the scientific rational behind these price patterns. Hence, we will look at how these price patterns are connected with “Fractal” and “Fractal Wave”. The scientific knowledge around these price patterns will help you to understand the flow of the financial market as said by Mark Twain “History Doesn’t Repeat, But It Often Rhymes”. In addition, you will find out that “Fractal” and “Fractal Wave” is the powerful tool to overcome the limitation of the modern trend and cycle analysis. The price patterns are in fact the practical application of “Fractal” and “Fractal Wave” in the financial market. Furthermore, we will provide the universal pattern framework to help you understand these price patterns with one unified knowledge. Therefore, we will make use of the X3 Pattern Framework while educating these price patterns.
About this Article
This article is the part taken from the draft version of the Book: Science Of Support, Resistance, Fibonacci Analysis, Harmonic Pattern, Elliott Wave and X3 Chart Pattern. Full version of the book can be found from the link below:
https://algotrading-investment.com/portfolio-item/science-of-support-resistance-fibonacci-analysis-harmonic-pattern/
With Fractal Pattern Scanner, you can quantify your trading opportunity with the support and resistance whether they are diagonal or horizontal. Below is the landing page for Fractal Pattern Scanner in MetaTrader version.
https://www.mql5.com/en/market/product/49170
https://www.mql5.com/en/market/product/49169
https://algotrading-investment.com/portfolio-item/fractal-pattern-scanner/
Below is the landing page for Optimum Chart, which is the standalone tool to scan the trading opportunities for all symbols and all timeframe in one button click.
https://algotrading-investment.com/2019/07/23/optimum-chart/

Young Ho Seo
Volatility Indicator for Day Trading
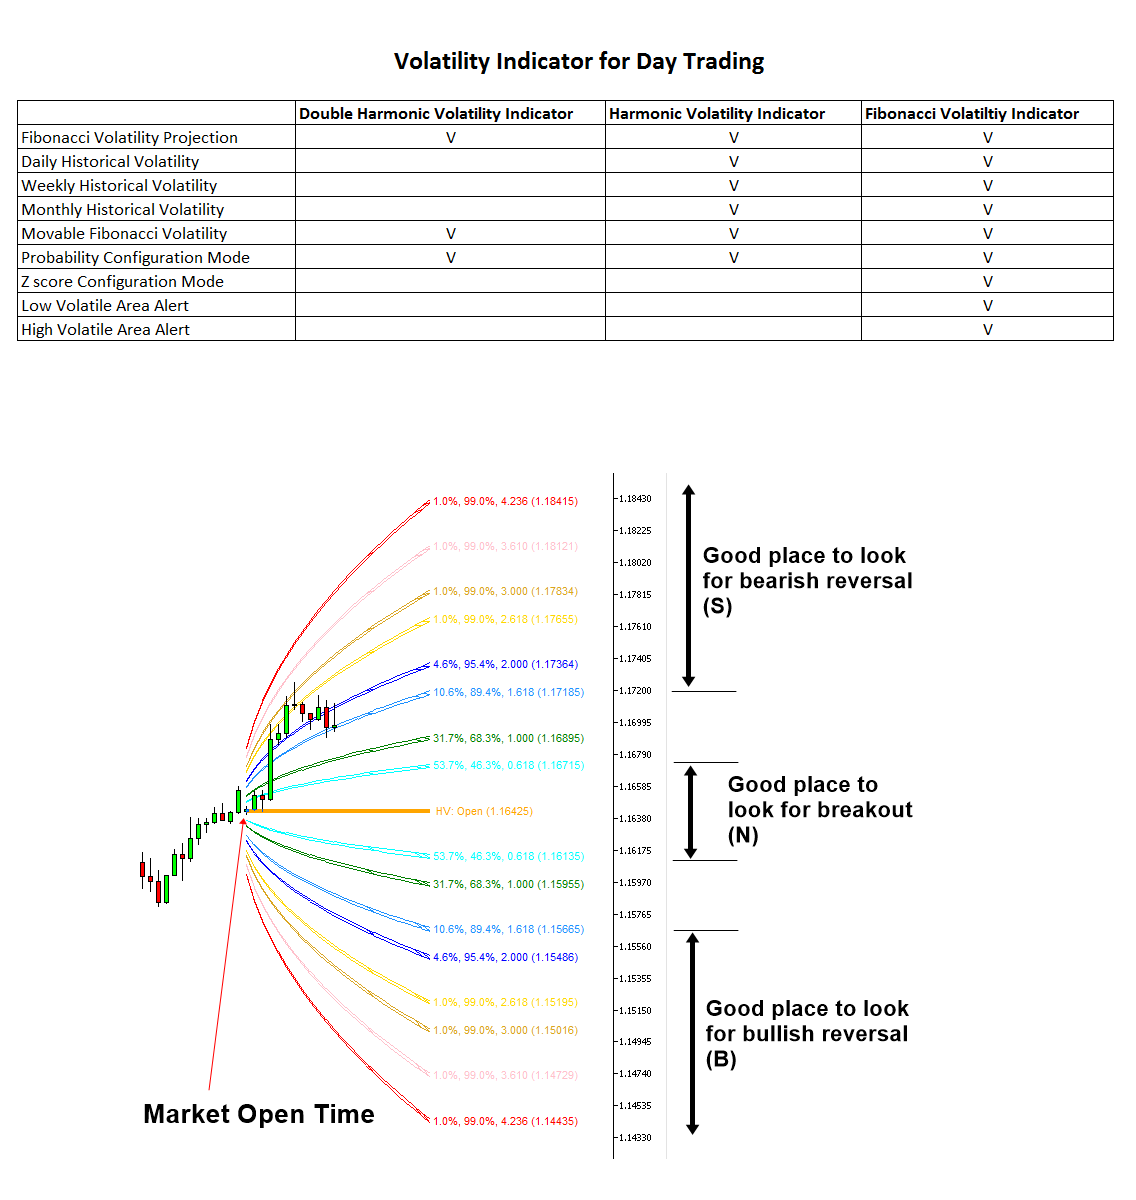
Volatility indicator can help you to detect any statistical advantage for your day trading. Especially, if you are trading with Price Action and Price Patterns, then we recommend using the Volatility indicator together with your strategy. Without the volatility indicator, you can make small and big mistakes often. We provide the advanced volatility indicators for MetaTrader 4 and MetaTrader 5 platform.
Fibonacci Volatility Indicator
Fibonacci Volatility indicator can provide the market volatility in visual form in your chart for your trading. You can use Daily, Weekly, Monthly and Yearly Volatility for your trading. The most important application of this Volatility indicator is to detect the potential breakout area, potential bullish reversal area and potential bearish reversal area. When you want to visualize the Volatility for your trading, this is the best tool available in the market. Additionally, you can also use the Movable Volatility indicator and you can set the alert at low and high volatile area in your chart.
https://www.mql5.com/en/market/product/52671
https://www.mql5.com/en/market/product/52670
https://algotrading-investment.com/portfolio-item/fibonacci-volatility-indicator/
Harmonic Volatility Indicator
Harmonic Volatility indicator also provides the market volatility in visual form in your chart for your trading. This tool can be used to visualize the Daily, Weekly, Monthly and Yearly Volatility. The difference between Harmonic Volatility indicator and Fibonacci Volatility indicator is that you can only use Probability Configuration mode in the Harmonic Volatility indicator whereas in the Fibonacci Volatility indicator you can access both Probability Configuration and Z Score configuration. This is cheaper than Fibonacci Volatility indicator. Hence, this is the light version of the Fibonacci Volatility indicator.
https://www.mql5.com/en/market/product/29008
https://www.mql5.com/en/market/product/29004
https://algotrading-investment.com/portfolio-item/harmonic-volatility-indicator/
Double Harmonic Volatility Indicator
This is the cheapest Volatility indicator. This indicator is specialized in the Movable Volatility indicator mostly. Hence, if you only need the Movable Volatility indicator and you want to have more cost effective tool, then use this. However, if you want to have more choice in the Volatility visualization, then use either Harmonic Volatility indicator or Fibonacci Volatility indicator.
https://www.mql5.com/en/market/product/23779
https://www.mql5.com/en/market/product/23769
https://algotrading-investment.com/portfolio-item/double-harmonic-volatility-indicator/
GARCH improved Nelder Mead – Free indicator
This is free Volatility indicator that implements the Generalized Autoregressive Conditional Heteroskedasticity (GARCH) methods with Nelder Mead algorithm. This is bit of experimental indicator to realize the GARCH (1,1) model. Hence, we provide this indicator for free. It would be interesting to see how this Volatility indicator works for your trading.
https://www.mql5.com/en/market/product/6918
https://www.mql5.com/en/market/product/6910
https://algotrading-investment.com/portfolio-item/garch-improved-nelder-mead/
In addition, you can watch this YouTube video titled as “Volatility Indicator for Day Trading” to feel what the Volatility indicator looks like in MetaTrader 4 and MetaTrader 5 platform.
YouTube Video “Volatility Indicator for Day Trading” : https://youtu.be/erWhucDT_6M

Young Ho Seo
Trading Zone Extended From Support Resistance
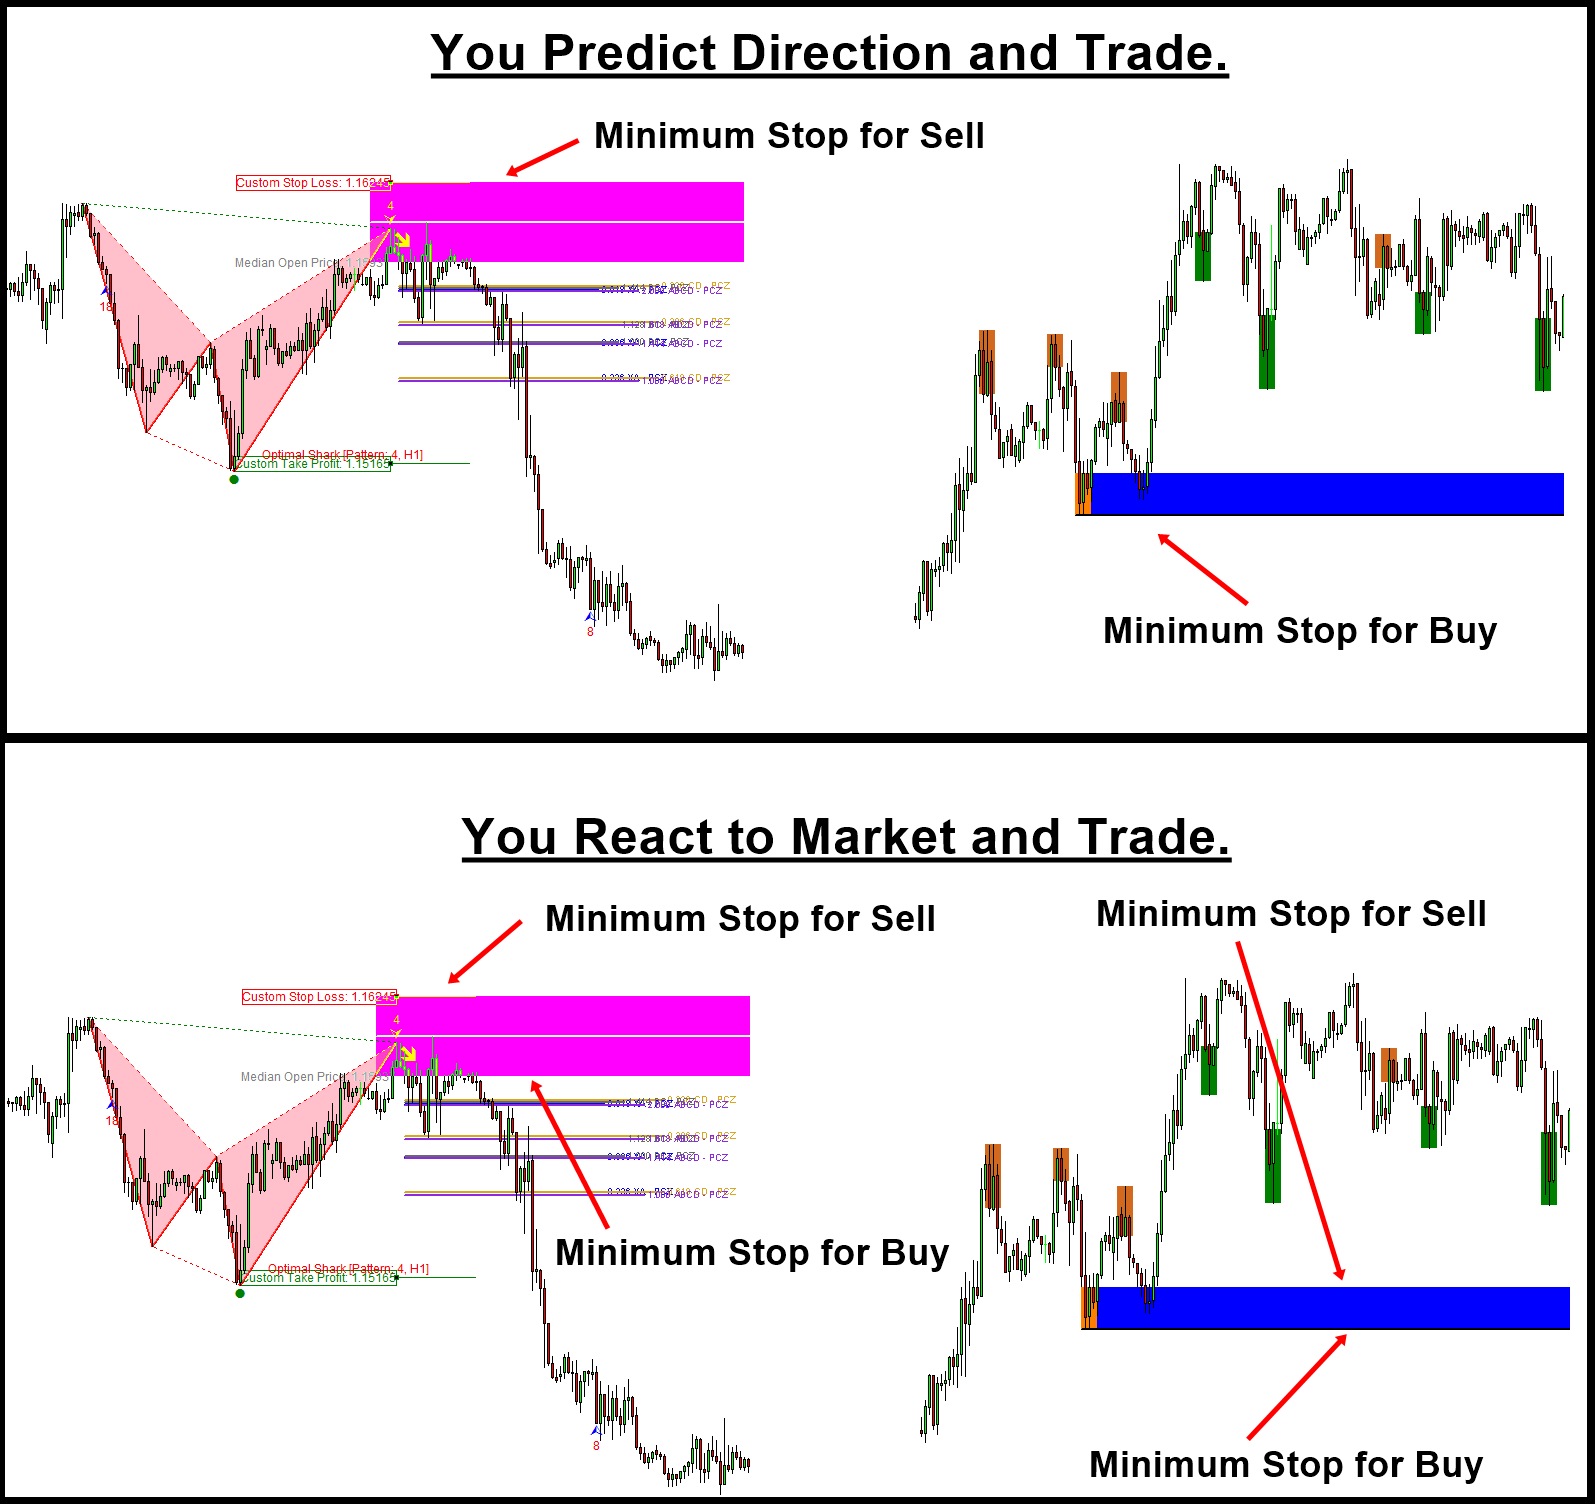
Trading zone in technical analysis is the extended concept from the horizontal support and resistance. The zone is the great tool to decide your trading entry and exit as well as managing your risk and reward. Especially, when the zone is drawn around the significant peak and trough, the value for the trading zone is precious. When you use Harmonic Pattern or X3 Chart Pattern, the trading zone can be identified using the Pattern Completion Interval. The detailed process is well described in the Book: Guide to Precision Harmonic Pattern Trading (2016). When you use the supply demand analysis, the zone is identified from the base location. Especially, it is even better if the trading zone is non repainting. The non repainting zone become the powerful tool to decide the entry and exit for your trading because they stay in the location always as the reference.
https://play.google.com/store/books/details?id=8SbMDwAAQBAJ
The trading zone is useful if your trading strategy is based on predicting the market direction. In such a case, the trading zone can provide a sensible place for stop loss. Then you can scale up your take profit target according to your anticipated location. Even if your trading strategy is not based on predicting market direction, the trading zone is still useful. For example, let’s say that you never want to predict the market, but you want to react the market so that you will trade in the direction in which the price is pushed by crowd like support and resistance style. In this case, the trading zone acts like the horizontal support resistance. But the managing your reward and risk is much easier than other mean of support and resistance.
I used the word minimum stop loss instead of the stop loss because sometimes, you might need to make your stop loss slightly bigger than the actual zone. The margin for the stop loss will be depending on your reward to risk ratio. How this reward to risk system works is well described in the latest book: Technical Analysis in Forex and Stock Market (2021).
https://play.google.com/store/books/details?id=pHlMEAAAQBAJ
For your information, we also provide the MetaTrader 4 and MetaTrader 5 indicators that provide the non repainting trading zone. You can have a look at these automated scanner, which you can trade with the direction prediction strategy as well as the react to market strategy.
Here is the link to Ace Supply Demand Zone Indicator for MetaTrader 4/MetaTrader 5.
https://www.mql5.com/en/market/product/40076
https://www.mql5.com/en/market/product/40075
https://algotrading-investment.com/portfolio-item/ace-supply-demand-zone/
Here is the link to X3 Chart Pattern Scanner for MetaTrader 4/ MetaTrader 5.
https://www.mql5.com/en/market/product/41993
https://www.mql5.com/en/market/product/41992
https://algotrading-investment.com/portfolio-item/profitable-pattern-scanner/

Young Ho Seo
Advanced Price Pattern Scanner Versus Price Breakout Pattern Scanner
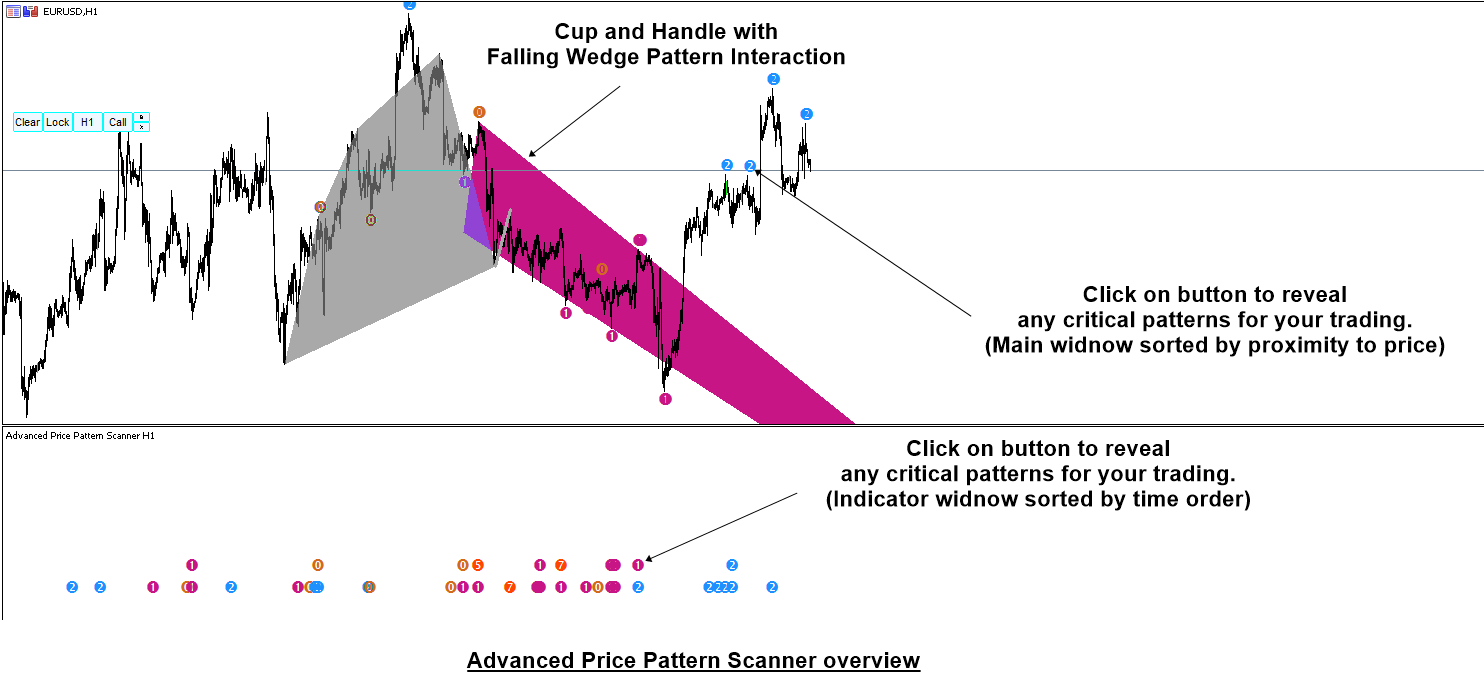
Many of you can be curious how our Advanced Price Pattern Scanner and Price Breakout Pattern Scanner are different from each other. Simply speaking, Advanced Price Pattern Scanner is the non repainting price pattern scanner whereas Price Breakout Pattern Scanner is based on repainting pattern detection. You will feel that Advanced Price pattern Scanner is using completely new pattern detection algorithm from Price Breakout Pattern Scanner. Even same patterns are detected in different timing between them due the the different pattern detection algorithm.
However, Advanced Price Pattern Scanner is more expensive. Hence, if you are concerned with the price. Then you can still go ahead with Price Breakout Pattern Scanner. Price Breakout Pattern Scanner will do generally everything for your need from price pattern detection + Japanese candle stick pattern detection and so on. If you need the non repainting price pattern scanner, we certainly recommend to use Advanced Price Pattern Scanner. In addition, Advanced Price Pattern Scanner also provides the multiple timeframe pattern detection helping you to reduce number of charts to open.
Here are the links for Advanced price Pattern Scanner.
https://algotrading-investment.com/portfolio-item/advanced-price-pattern-scanner/
https://www.mql5.com/en/market/product/24679
https://www.mql5.com/en/market/product/24678
Below are the links to Price breakout Pattern Scanner
https://www.mql5.com/en/market/product/4859
https://www.mql5.com/en/market/product/4858
https://algotrading-investment.com/portfolio-item/price-breakout-pattern-scanner/

Young Ho Seo
Gartley Pattern Trading
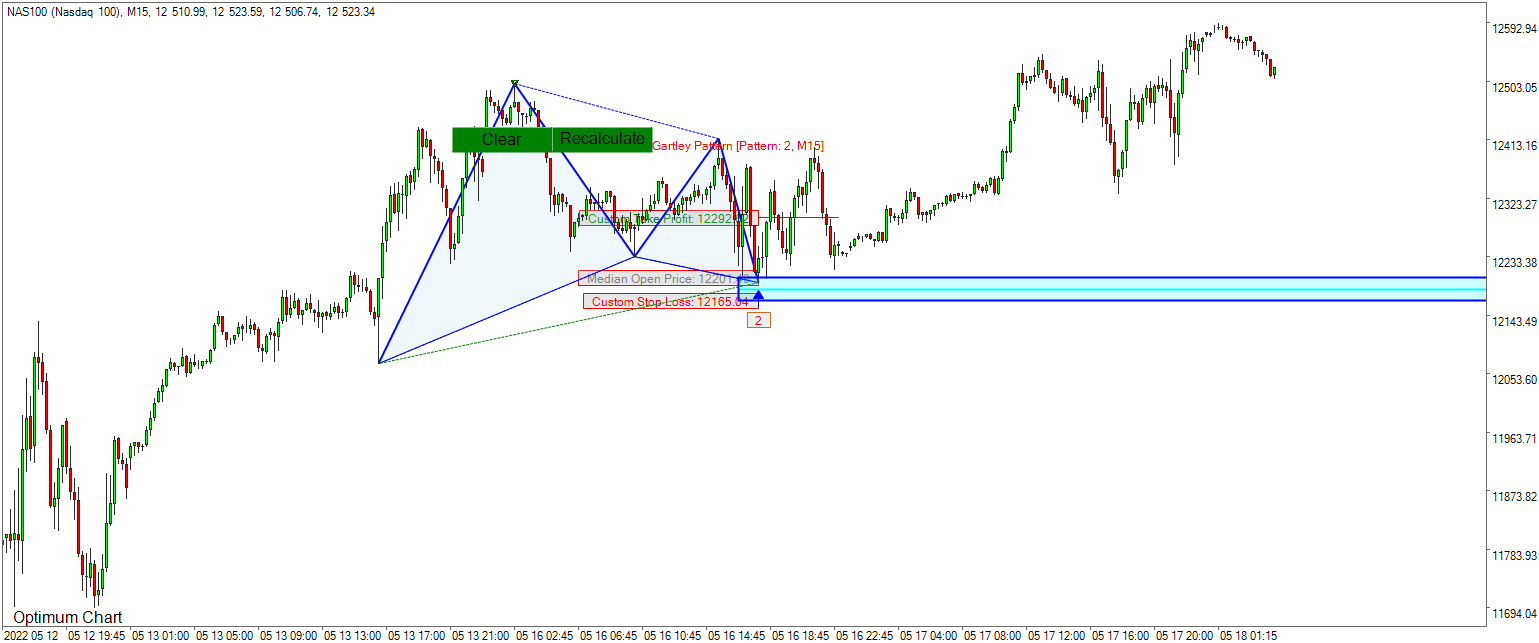
This study provides the guidance for Gartley Pattern Trading by examing 96 Gartley Patterns, historically formed in Forex and stock market index Chart. First screenshot is taken with Garltey Pattern only. Second screenshot is taken with Gartley pattern + Supply Demand Zone + Bollinger Bands. So there are 192 screenshots (96 x 2) in this study. This study uses non repainting and non lagging Harmonic Pattern detection algorithm. Hence, this study will show both failed and successful pattern to provide you the unbiased results. Typically, a repainting indicator will show the successful pattern making it hard to check the real performance of your strategy in historical study in your chart. If you want to become a profitable trader, you should study the strategy in the scientific manner. It basically involves checking the repeatability or reproducibility. We provide this study to enhance the forex and stock trading for the trading community. We also want to add some scientific value for the Harmonic Pattern, X3 Chart Pattern and Elliott Wave Pattern too. The Gartley Pattern in this study has the following Structure:
N: 3, C0: 0.618 to T0: 3
R0: 1.272, R1: 0.382 -0.886, R2: 0.618
Points to watch out in this study:
Price movement around the Pattern Completion Zone (= Trading Zone) in the Gartley Pattern
Supply Demand Zone interaction with Gartley Pattern
Risk management around the Trading Zone. Look for the trading entry, where at least, Reward > Risk x 2
Possibility for breakout trading around the trading zone (=use them as support and resistance)
Look for continuation pattern vs reversal pattern
You can find some Reference for this study below:
Science Of Support, Resistance, Fibonacci Analysis, Harmonic Pattern, Elliott Wave and X3 Chart Pattern (In Forex and Stock Market Trading)
Guide to Precision Harmonic Pattern Trading (Mastering Turning Point Strategy for Financial Trading)
Technical Analysis in Forex and Stock Market (Supply Demand Analysis and Support Resistance)
Profitable Chart Patterns in Forex and Stock Market (Fibonacci Analysis, Harmonic Pattern, Elliott Wave, and X3 Chart Pattern)
Scientific Guide to Price Action and Pattern Trading (Wisdom of Trend, Cycle, and Fractal Wave)
Here is the YouTube Link for Gartly Pattern Trading: https://youtu.be/J3vjlHatUTI
This study was performed using the Robo Advisor built inside Optimum Chart.
https://algotrading-investment.com/2019/07/23/optimum-chart/
You can also check the similar results using the X3 Chart Pattern Scanner in MetaTrader 4 and MetaTrader 5 platform (Non repainting and non lagging algorithm).
https://www.mql5.com/en/market/product/41993
https://www.mql5.com/en/market/product/41992
https://algotrading-investment.com/portfolio-item/profitable-pattern-scanner/
Harmonic Pattern Plus is the repainting Harmonic Pattern Scanner with tons of powerful features at affordable cost.
https://algotrading-investment.com/portfolio-item/harmonic-pattern-plus/
https://www.mql5.com/en/market/product/4488
https://www.mql5.com/en/market/product/4475
Harmonic Pattern Scenario Planner is the advanced repainting Harmonic Pattern Scanner with tons of powerful features at affordable cost.
https://algotrading-investment.com/portfolio-item/harmonic-pattern-scenario-planner/
https://www.mql5.com/en/market/product/6101
https://www.mql5.com/en/market/product/6240

Young Ho Seo
Non Repainting Harmonic Pattern Scanner
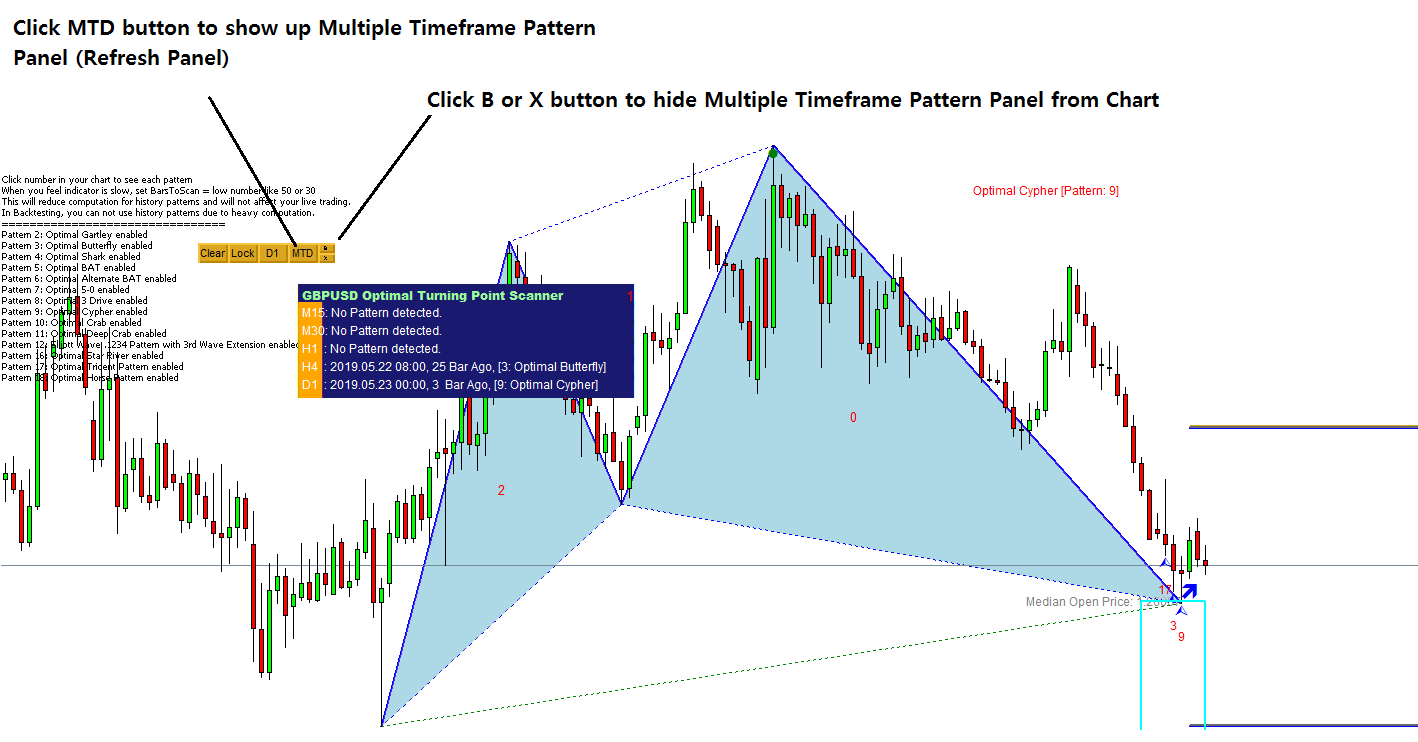
X3 Chart Pattern Scanner is the Non Repainting Harmonic Pattern Scanner. X3 Chart Pattern Scanner provides such a turning point prediction system. X3 Chart Pattern Scanner is non lagging too. Each pattern is fully customizable meaning that you can optimize each pattern for your need. If you are using MetaTrader 4/5, this is an essential tools for your trading plan.
Here is an intro Video for Non Repainting Harmonic Pattern Scanner. This video will explain some features of X3 Chart Pattern Scanner, the non repainting, non lagging harmonic pattern and Elliott Wave pattern indicator. Please check the video out.
YouTube: https://www.youtube.com/watch?v=uMlmMquefGQ&feature=youtu.be
Below is the link to Non Repainting and Non Lagging Harmonic Pattern and Elliott Wave Pattern Indicator.
https://algotrading-investment.com/portfolio-item/profitable-pattern-scanner/
https://www.mql5.com/en/market/product/41993
https://www.mql5.com/en/market/product/41992

Young Ho Seo

Volume Spread Analysis Indicator List
We provide three different Volume Spread Analysis indicators and volume based tools. Our volume spread analysis tools are the hybrid of volume spread analysis and signal processing theory.
These tools will help you to complete your trading decision with high precision. As long as you understand the concept of the Accumulation and Distribution area in the volume spread analysis, these tools will help you to predict the presence of Accumulation and Distribution area. Hence, you can predict the best trading opportunity.
Firstly, Volume Spread Pattern Indicator is the powerful volume spread analysis indicator that operated across multiple timeframe. Volume Spread Pattern Indicator will not only provide the bearish and bullish volume spread pattern in the current time frame but also it will detect the same patterns across all timeframe. You just need to open one chart and you will be notified bullish and bearish patterns in all timeframe in real time.
Here is the link to Volume Spread Pattern Indicator.
https://www.mql5.com/en/market/product/32961
https://www.mql5.com/en/market/product/32960
https://algotrading-investment.com/portfolio-item/volume-spread-pattern-indicator/
Secondly, Volume Spread Pattern Detector is the light version of Volume Spread Pattern Indicator above. This is free tool with some limited features. However, Volume Spread Pattern Detector is used by thousands of traders. Especially, it works great with the support and resistance to confirm the turning point. This is free tool. Just grab one.
https://www.mql5.com/en/market/product/28438
https://www.mql5.com/en/market/product/28439
https://algotrading-investment.com/portfolio-item/volume-spread-pattern-detector/
Both Volume Spread Pattern Indicator and Volume Spread Pattern Detector works well with Excessive Momentum indicator as Excessive Momentum indicator helps to detect the potential Accumulation and Distribution area automatically. Hence, if you are using Excessive Momentum Indicator, then you can use one between Volume Spread Pattern Indicator or Volume Spread Pattern Detector. In addition, we provide the YouTube video to accomplish the basic operations of Excessive Momentum Indicator.
YouTube Video (Momentum Indicator): https://youtu.be/oztARcXsAVA
Here is link to Excessive Momentum Indicator for MetaTrader 4 and MetaTrader 5.
https://algotrading-investment.com/portfolio-item/excessive-momentum-indicator/
https://www.mql5.com/en/market/product/30641
https://www.mql5.com/en/market/product/30621
Thirdly, we provide the volume Zone Oscillator. This is another useful free tool that utilizes the volume information for your trading. You can use these tools for volume spread analysis, Harmonic Pattern, Elliott Wave Pattern, X3 Price Pattern further. This is free tool. Just grab one.
https://algotrading-investment.com/portfolio-item/volume-zone-oscillator/

Young Ho Seo
Harmonic Pattern Signal – Free
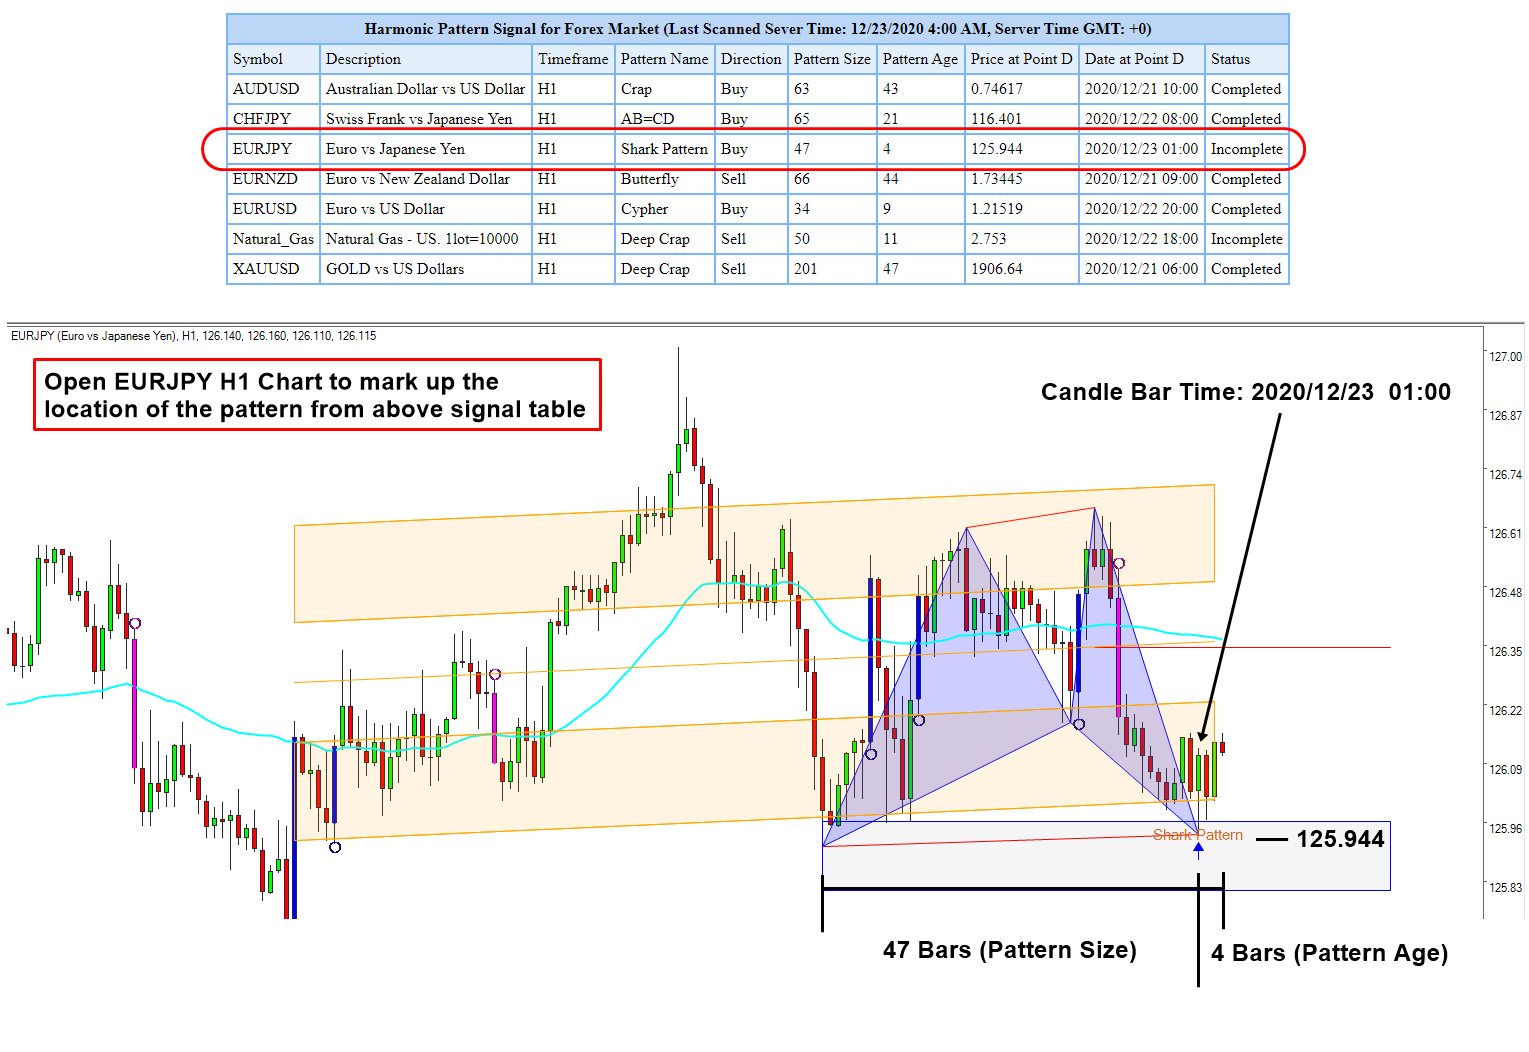
Harmonic Pattern Trading Signal provides a mean of detecting the turning point in the market. It is one way to solve the puzzle of market geometry, which is often not solvable with other technical indicators. Especially, we provide the Harmonic Pattern Signal for your trading. It is absolutely free of charge. The Harmonic Pattern Signal can be accessible from the link below.
https://algotrading-investment.com/2020/12/17/harmonic-pattern-signal-for-forex-market/
We present the trading signal in the simple table form. To use this trading signal, you need to mark up the location of the Harmonic Pattern in your chart. You can do this in any trading platform including MetaTrader, Trading View, Ninja Trader and so on. Follow the two steps below:
Open the Chart with the same timeframe shown in the table
Mark up the pattern location using Price at Point D and Date at Point D
That is all. Check the attached screenshot and more detailed Instruction can be found from the above link. Our Harmonic Pattern Trading signal is absolutely free. It is a good staring point for anyone who are interested in trading Forex market. At the same time, we provide the MetaTrader 4 and MetaTrader 5 version of Harmonic Pattern Scanner. If you prefer the indicator version of Harmonic Pattern Signal, then you can visit the product page for Harmonic Pattern Plus or X3 Chart Pattern Scanner.
=================================================
In addition, you can watch the YouTube Video to feel what is the automated harmonic pattern indicator like. For your information, we provides two YouTube videos with title and links below.
YouTube “Harmonic Pattern Indicator”: https://youtu.be/CzYUwk5qeCk
YouTube “Non Repainting Non Lagging Harmonic Pattern Indicator”: https://youtu.be/uMlmMquefGQ
Below are the Links to Harmonic Pattern Plus
https://www.mql5.com/en/market/product/4488
https://www.mql5.com/en/market/product/4475
https://algotrading-investment.com/portfolio-item/harmonic-pattern-plus/
Below are the Links to X3 Chart Pattern Scanner.
https://www.mql5.com/en/market/product/41993
https://www.mql5.com/en/market/product/41992
https://algotrading-investment.com/portfolio-item/profitable-pattern-scanner/

Young Ho Seo
Harmonic Pattern – Predict Turning Point
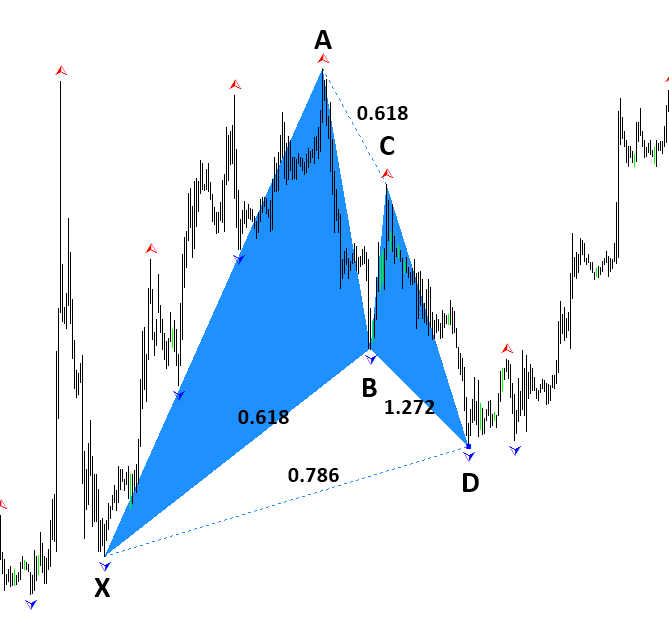
Before using Harmonic Patterns, it is necessary to ask the rational behind the harmonic pattern. In fact, you will do the same for any trading strategy. You should never blindly trade because some one recommend you any particular strategy or you read some articles on website. You need to take sufficient time to understand the rational behind the trading strategy and then you will move on to the operation with the trading strategy. This article “Patterns are the Good Predictor of Market Turning Point” is such an article helping you to understand the rational behind the harmonic patterns and its trading strategy. If you are harmonic pattern trader, then you must read this article.
https://algotrading-investment.com/2019/07/07/patterns-are-the-good-predictor-of-market-turning-point/
In addition, you can watch the YouTube Video titled feel what is the automated harmonic pattern indicator like. For your information, we provides two YouTube videos with title and links below.
YouTube “Harmonic Pattern Indicator”: https://youtu.be/CzYUwk5qeCk
YouTube “Non Repainting Non Lagging Harmonic Pattern Indicator”: https://youtu.be/uMlmMquefGQ
=============================
Here are some list of the harmonic pattern indicators available in MetaTrader 4 and MetaTrader 5 platform. We also include some description for each harmonic pattern indicator.
Harmonic Pattern Plus
One of the first automated Harmonic Pattern detection tool released in 2014. It can detect 11 most popular harmonic patterns with well-defined trading entries and stops. Pattern Completion Interval, Potential Reversal Zone and Potential Continuation Zone are supported. In addition, other dozens of powerful features are added like Japanese candlestick detection, etc. Because of affordable price, this harmonic pattern detection indicator is loved by many traders. Please note that this is repainting and non lagging harmonic pattern trading system.
https://www.mql5.com/en/market/product/4488
https://www.mql5.com/en/market/product/4475
https://algotrading-investment.com/portfolio-item/harmonic-pattern-plus/
Harmonic Pattern Scenario planner
It is an advanced Harmonic Pattern indicator. On top of the features of Harmonic Pattern Plus, you can also predict future harmonic patterns through simulation. This is the tactical harmonic pattern tool designed for Professional harmonic pattern trader. Because of affordable price, this harmonic pattern detection indicator is loved by many traders. Please note that this is repainting and non lagging harmonic pattern trading system.
https://www.mql5.com/en/market/product/6240
https://www.mql5.com/en/market/product/6101
https://algotrading-investment.com/portfolio-item/harmonic-pattern-scenario-planner/
Both Harmonic pattern plus and Harmonic Pattern Scenario planner are the excellent trading system at affordable cost. However, if you do not like repainting Harmonic pattern indicator, then we also provide the non repainting and non lagging harmonic pattern trading. Indeed, the X3 Chart Pattern Scanner is the most advanced Harmonic Pattern and Elliott Wave pattern scanner. Just check the X3 Chart Pattern Scanner below.
Link to X3 Chart Pattern Scanner
https://www.mql5.com/en/market/product/41993
https://www.mql5.com/en/market/product/41992
https://algotrading-investment.com/portfolio-item/profitable-pattern-scanner/

: