Press review - page 401
You are missing trading opportunities:
- Free trading apps
- Over 8,000 signals for copying
- Economic news for exploring financial markets
Registration
Log in
You agree to website policy and terms of use
If you do not have an account, please register
NZD/USD Intra-Day Fundamentals: NZ Trade Balance and 22 pips price movement
2016-05-24 22:45 GMT | [NZD - Trade Balance]
if actual > forecast (or previous one) = good for currency (for GBP in our case)
[NZD - Trade Balance] = Difference in value between imported and exported goods during the reported month.
==========
For April 2016 compared with April 2015:
==========
NZD/USD M5: 22 pips price movement by NZ Trade Balance news event
Technical Analysis for Brent Crude Oil: key resistance level at 49.82 to be broken for the bullish trend to be continuing; 53.95 is the next target (adapted from the article)
Daily price is on primary bullish market condition located above 100-day SMA/200-day SMA reversal area: the price is on ranging within the following key narrow s/r levels:
USD/CAD Intra-Day Fundamentals: BoC Overnight Rate and 69 pips price movement
2016-05-25 14:00 GMT | [CAD - Overnight Rate]
if actual > forecast (or previous one) = good for currency (for CAD in our case)
[CAD - Overnight Rate] = Interest rate at which major financial institutions borrow and lend overnight funds between themselves.
==========
"The Bank of Canada today announced that it is maintaining its target for the overnight rate at 1/2 per cent. The Bank Rate is correspondingly 3/4 per cent and the deposit rate is 1/4 per cent."==========
USD/CAD M5: 69 pips price movement by BoC Overnight Rate news event
U.S. Commercial Crude Oil Inventories news event: bullish ranging above bearish reversal
2016-05-25 14:30 GMT | [USD - Crude Oil Inventories]
[USD - Crude Oil Inventories] = Change in the number of barrels of crude oil held in inventory by commercial firms during the past week.
==========
"U.S. commercial crude oil inventories (excluding those in the Strategic Petroleum Reserve) decreased by 4.2 million barrels from the previous week."
==========
Crude Oil M5: bullish ranging above bearish reversal. The price is on ranging to be above 200 period SMA within 49.65 resistance and 49.14 support levels.
If the price breaks 49.65 resistance level so the intra-day primary bullish trend will be continuing.
If the price breaks 49.14 support so the reversal of the M5 price movement from the primary bullish to the primary bearish market condition will be started.
If not so the price will be on ranging within the levels.
AUD/USD Intra-Day Fundamentals: Private Capital Expenditure and 36 pips price movement
2016-05-26 01:30 GMT | [AUD - Private Capital Expenditure]
if actual > forecast (or previous one) = good for currency (for AUD in our case)
[AUD - Private Capital Expenditure] = Change in the total inflation-adjusted value of new capital expenditures made by private businesses.
==========
==========
AUD/USD M5: 36 pips price movement by Private Capital Expenditure news event
What’s Expected:
"Why Is This Event Important:Even though Fed Chair Janet Yellen remains in no rush to implement higher borrowing-costs, we may see a greater dissent at the next quarterly meeting in June as a growing number of central bank officials see the U.S. economy approaching ‘full-employment.’"
Daily Targets
EURUSD D1
Intra-Day Targets
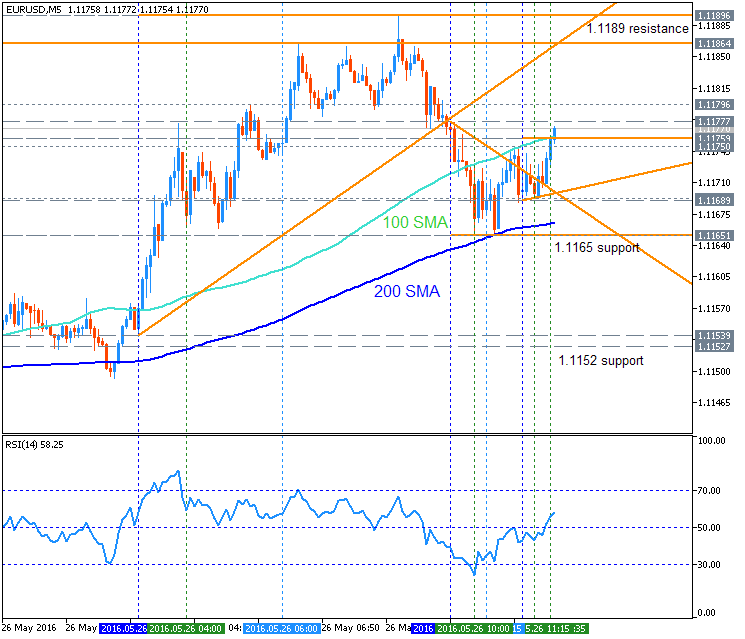
EURUSD M5
GBP/USD Intra-Day Fundamentals: U.K. Total Business Investment and 47 pips price movement
2016-05-26 08:30 GMT | [GBP - Total Business Investment]
if actual > forecast (or previous one) = good for currency (for GBP in our case)
[GBP - Total Business Investment] = Change in the total inflation-adjusted value of capital investments made by businesses and the government.
==========
==========
GBP/USD M5: 47 pips price movement by U.K. Total Business Investment news event
Forum on trading, automated trading systems and testing trading strategies
Press review
Sergey Golubev, 2016.05.26 10:55
...
Intra-Day TargetsEURUSD M5

EUR/USD M5: 47 pips price movement by Durable Goods Orders news event
Fed Chair Yellen Speaks - "We do not expect any comments on the near-term"
2016-05-27 17:15 GMT | [USD - Federal Reserve Chair Janet Yellen Speech]
Barclays:
==========
H4 price is located below SMA with the period 200 (200-SMA) for the primary bearish market condition for the ranging within 1.1216 resistance level and 1.1128 support level. Ascending triangle pattern was formed by the price to be crossed to above for the secondary rally to be started with 1.1242 level as a nearest target to re-enter. The bullish reversal level at 1.1348 located near and abvove 200 SMA, and if the price breaks this level to above so the bullish reversal of the intra-day price movement will be started.
"An upward revision in the preliminary 1Q Gross Domestic Product (GDP) report may trigger near-term selloff in EUR/USD as signs of a stronger recovery provide the Federal Open Market Committee (FOMC) with greater scope to implement higher borrowing-costs."
What’s Expected:
Why Is This Event Important:
"With the U.S. economy approaching ‘full-employment,’ a faster rate of growth may encourage a greater number of Fed officials to vote for a rate-hike at the next quarterly meeting in June as the central bank sees a sustainable recovery over the policy horizon."
Intra-Day Levels
EURUSD H1
The price is located below 200 SMA for the bearish market condition - price is on ranging around 100 SMA waiting for direction of the trend:
If the price breaks 1.1174 support level on close hourly bar so the primary bearish trend will be continuing up to 1.1138 as a good target to re-enter.
If the price breaks 1.1236 resistance level on close hourly bar so the reversal of the price movement from the ranging bearish to the primary bullish trend will be started.
If not so the price will be on ranging within the levels waiting for direction.