Market Condition Evaluation based on standard indicators in Metatrader 5 - page 177
You are missing trading opportunities:
- Free trading apps
- Over 8,000 signals for copying
- Economic news for exploring financial markets
Registration
Log in
You agree to website policy and terms of use
If you do not have an account, please register
Forum on trading, automated trading systems and testing trading strategies
Press review
Sergey Golubev, 2016.06.07 08:15
AUD/USD Intra-Day Fundamentals: RBA Cash Rate and 64 pips price movement
2016-06-07 04:30 GMT | [AUD - RBA Cash Rate]
if actual > forecast (or previous one) = good for currency (for AUD in our case)
[AUD - RBA Cash Rate] = Interest rate charged on overnight loans between financial intermediaries.
==========
==========
AUD/USD M5: 64 pips price movement by RBA Cash Rate news event
Forum on trading, automated trading systems and testing trading strategies
forecast on Forex
Sergey Golubev, 2016.04.18 13:02
News is different from forecast, and forecast is different from technical analysis.
This is how I understand it:
------
Forecasts. You are following some system which is 'black box' for you and can not be disclosed in public. You just believe in this unknown system/person/trader/coder which is making forecast for you. Forecasts are made with no any alternatives, for example: "buy EUR/USD at 1.2440 now/tomorrow at 10 am etc."
It is similar with weather forecast (no one is responsible for false signal for example). There are free forecasts and commercial forecasts.
Technical analysis. The person is using indicators or/and price action to make a technical analysis describing the market condition in the past together with price movement explanation to the future on alternative ways. For example: "if the price breaks this level to above so ...., alternative - if the price this level to below so ...".
In this case - technical analysis is acting as the science which everybody can repeat in MT4/MT5, and you are always having the choice about what to do.
There are free technical analysis and commercial technical analysis.
There are some websites and sources which are publishing the articles with the word 'Forecast' but if you look at those articles so you will understand that it is the technical analysis only.
Analysts (the persons who are providing the technical analysis) consider the forecasts/forecasters as the forex scam (so, basicly they do not like each other).
We do not have forecasts on this part of the forum because it will be consider as an advertisement with commercial promotion anyway (technical analysis and forecasts can not be on the same subforums because of the differences between them: technical analysis is the science, and forecast is commercial or promotional service.
------
I mean - if someone will post some link to the website with the forex forecast/trading signals and so on (and if it will be real forecast without technical analysis) so this your thread will be deleted sorry.
Forum on trading, automated trading systems and testing trading strategies
forecast on Forex
Sergey Golubev, 2016.04.18 13:17
But there are more confusion related to forecasts ... On the post above - I described the differences between technical analysis and forecasts.And there are some differences between forecasts and signal services too. For example, the best way to check forecast/forecaster is to ask him to provide the signals so everybody will see/check the results. But in case of forecasts - it is not very good way because forecasts are making once in a month or once in a week so I think - no one will subscribe to the signals which are trading one time in a month/week just to prove some article/post about "where the price will go to in May" for example ... so ...
Forecasts, signal services and technical analysis are 3 different services: we have just one of them here - signals as a service (and free technical analysis by free indicators from CodeBase here on the forum).
Forum on trading, automated trading systems and testing trading strategies
Press review
Sergey Golubev, 2016.06.08 20:21
Trading News Events: Reserve Bank of New Zealand Official Cash Rate (adapted from the article)
M5 price is located above 100 period SMA and 200 period SMA for the bullish market condition: the price is on ranging within the following support/resistance levels:
If M5 price breaks 0.7000 support level to below on close bar so the reversal of the intra-day price movement from the primary bullish to the primary bearish market condition will be started.
If M5 price will break 0.7053 resistance level on close bar so the bullish trend will be continuing.
If not so the price will be on ranging within the levels.
Daily price is located above Ichimoku cloud and Senkou Span line which is the virtual border between the primary bearish and the primary bullish trend on Ichimoku chart. The price is breaking 0.6980 resistance level to above on daily open bar for 0.7053 level as the next bullish target to re-enter. Chinkou Span line is breaking the price to above for good possible breakout, and Absolute Strength indicator together with Trend Strength indicator are estimating the bullish trend to be continuing.
Forum on trading, automated trading systems and testing trading strategies
Press review
Sergey Golubev, 2016.06.09 06:17
NZD/USD M5: 110 pips range price movement by RBNZ Official Cash Rate news event
M5 price broke 0.7026/0.7053 resistance levels to above: the price is testing 0.7137 resistance for the intra-day bullish trend to be continuing.
Besides, daily bar was opened to be above 0.7053 level which is indicating the crossing it to above on close D1 bar for the daily bullish trend continuation.
Forum on trading, automated trading systems and testing trading strategies
Forecast for Q2'16 - levels for S&P 500
Sergey Golubev, 2016.06.09 16:52
S&P 500 Technical Analysis: 9-month high to be broken
Daily price is on bullish market condition to be above Ichimoku cloud and above Senkou Span line (which is the virtual border between the primary bearish and the primary bullish trend on the chart). The price is testing 9-month high at 2119.25 to above for the bullish trend to be continuing. Alternative, if the price breaks 2082.50 support level so the secondary correction within the primary bullish trend will be started with 2031.05 bearish reversal target.
Forum on trading, automated trading systems and testing trading strategies
Press review
Sergey Golubev, 2016.06.10 11:53
Trading News Events: Canada's Employment Change (adapted from the article)"Despite forecasts for an uptick in the jobless rate, a 1.8K rebound in Canada Employment may heighten the appeal of the loonie and spur a near-term decline in USD/CAD as the data highlights an improved outlook for growth and inflation."
What’s Expected:
Why Is This Event Important:
"Even though the Bank of Canada (BoC) retains a cautious outlook for the real economy, Governor Stephen Poloz and Co. may stick to the sidelines throughout 2016 and show a greater willingness to gradually move away from its easing cycle especially as Prime Minister Justin Trudeau implements fiscal support to encourage a stronger recovery."
====
USD/CAD Technical Analysis: bearish ranging near bullish reversal within narrow s/r levels waiting for direction
Daily price was on breakout with the bearish reversal: price broke Ichimoku cloud to below to be reversed to the primary bearish market condition. For now, the price is moved along one of the Senkou Span line for the bullish trend to be resumed or for the bearish trend to be continuing.
Absolute Strength indicator is estimating the ranging condition, and Trend Strength indicator is evaluating the trend as the primary bearish in the near future.
If D1 price will break 1.2654 support level on close bar so the primary bearish trend will be continuing with 1.2460 level as a possible bearish target.
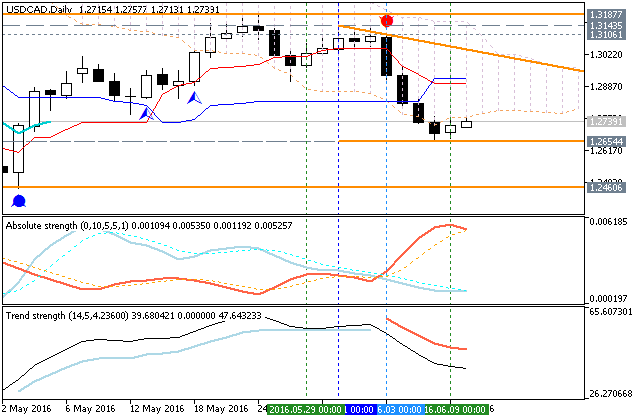
If D1 price will break 1.3187 resistance level on close bar so the price will be reversed back to the bullish market condition.
If not so the price will be on ranging within the levels.
SUMMARY : bearish
TREND : waiting to break the levels for directionForum on trading, automated trading systems and testing trading strategies
Forecast for Q2'16 - levels for USD/CAD
Sergey Golubev, 2016.06.10 12:03
==========
USD/CAD M5: 85 pips price movement by Canada's Employment Change news event
Forum on trading, automated trading systems and testing trading strategies
Forecast for Q2'16 - levels for US Dollar Index
Sergey Golubev, 2016.06.10 16:24
Dollar Index: End Of Week Technicals - ranging or bearish reversal breakdown to be continuing?
This trading week was continuing with the bearish reversal breakdown which was started on last Friday: the price broke the upper Senkou Span line to below to be bounced from the lower Senkou Span line to be above Ichimoku cloud. For now, the price is on ranging inside Ichimoku cloud with descending triangle pattern to be formed by the price for the breakdown to be continuing with 93.43 support level.
If D1 price will break 95.97 resistance level on close bar to above so the reversal of the price movement to the primaru bullish market condition will be started.If D1 price breaks 93.43 support level on close bar so the primary bearish trend will be continuing.
If not so we may see the ranging within the levels.
SUMMARY : bearish
TREND : rangingForum on trading, automated trading systems and testing trading strategies
Gold is Reaching at 1270
Sergey Golubev, 2013.07.01 21:04
How can we know: correction, or bullish etc (in case of using indicator for example)?
well ... let's take AbsoluteStrength indicator from MT5 CodeBase.
bullish (Bull market) :
bearish (Bear market) :
ranging (choppy market - means: buy and sell on the same time) :
flat (sideways market - means: no buy and no sell) :
correction :
correction in a bear market (Bear Market Rally) :
Forum on trading, automated trading systems and testing trading strategies
Forecast for Q2'16 - levels for USD/CAD
Sergey Golubev, 2016.06.12 18:44
Forecast for Tomorrow - levels for USD/CAD
H4 intra-day price is located below Ichimoku cloud in the bearish area of the chart: the price is on bear market rally to be started on open H4 bar by 1.2766 resistance level to be broken on the open bar for now. Absolute Strength indicator is estimating the secondary rally to be started, and if H4 bar is goint to be opened above 1.2766 level on Monday so the rally will be started, if not so the price will be on bearish ranging within narrow s/r levels.
If H4 price will break 1.2654 support level on close bar so the primary bearish trend will be continuing.
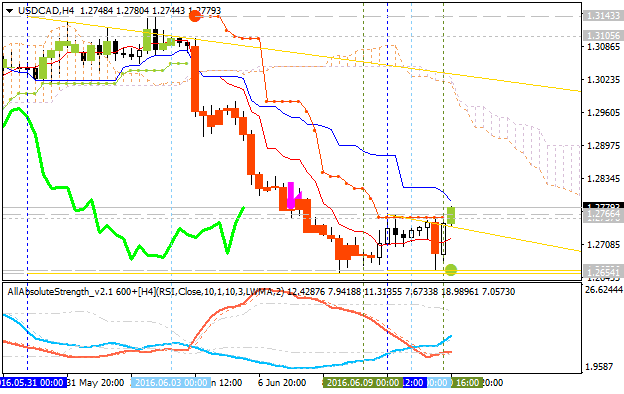
If H4 price will break 1.2766 resistance level on close bar so the local uptrend as the secondary market rally will be started.
If not so the price will be on ranging within the levels.
SUMMARY : bearish
TREND : bear market rallyForum on trading, automated trading systems and testing trading strategies
Press review
Sergey Golubev, 2016.06.13 10:24
EUR/USD Price Action Analysis - bullish ranging near 50.0% Fibo level for the secondary daily correction to the possible bearish reversal
Daily price is above 200 SMA and near-and-above 100 SMA for the bullish market condition with the ranging within Fibo resistance level at 1.1415 and Fibo bearish reversal level at 1.1070.
If the price will break Fibo support level at 1.1070 so the reversal of the price movement from the primary bullish to the primary bearish market condition will be started.
If the price will break Fibo resistance level at 1.1415 from below to above so the primary bullish trend will be continuing with good possible breakout of the price movement up to 1.1615 as a possible bullish target.
If not so the price will be ranging within the levels.
Trend:
D1 - ranging bullish near bearish reversal areaForum on trading, automated trading systems and testing trading strategies
Forecast for Q2'16 - levels for Hang Seng Index (HSI)
Sergey Golubev, 2016.06.13 20:14
Hang Seng Index Technical Analysis 2016, 12.06 - 19.06: daily breakdown with the bearish reversal
Daily price is breaking Ichimoku cloud to be reversed from the primary bullish to the primary bearish market condition: the price is testing 20,289 support level to below for the bearish breakdown to be continuing.
If D1 price will break 20,289 support level on close bar so the breakdown will be continuing with the bearish reversal to be started.
If D1 price will break 20.559 resistance level on close bar from below to above so the bullish trend will be resumed.
If not so the price will be on bearish ranging within the levels.
SUMMARY : breakdown
TREND : bearish reversal