Market Condition Evaluation based on standard indicators in Metatrader 5 - page 165
You are missing trading opportunities:
- Free trading apps
- Over 8,000 signals for copying
- Economic news for exploring financial markets
Registration
Log in
You agree to website policy and terms of use
If you do not have an account, please register
Forum on trading, automated trading systems and testing trading strategies
Forecast for Q2'16 - levels for US Dollar Index
Sergey Golubev, 2016.04.08 17:02
Dollar Index: End Of Week Technicals - daily bearish breakdown
Daily price is on primary bearish market condition: the price is on bearish breakdown for testing 94.32 support level for the bearish trend to be continuing with 94.02 support level as the next target to re-enter.
If the price breaks 94.02 support level so the primary bearish will be continuing.
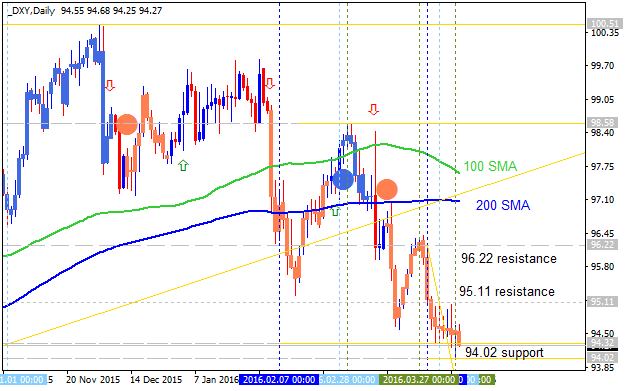
If the price breaks 95.11 resistance level so the local uptrend as the bear market rally will be started up to 96.22 resistance level as the next target to re-enter.
If the price breaks 96.22 resistance level so the reversal of the price movement from the primary bearish to the primary bullish trend may be started with the secondary ranging.
If not so the price will be ranging within the levels.
SUMMARY : bearish
TREND : breakdownForum on trading, automated trading systems and testing trading strategies
Forecast for Q2'16 - levels for EUR/USD
Sergey Golubev, 2016.04.10 11:37
EURUSD Technical Analysis 2016, 10.04 - 17.04: bullish ranging with narrow levels
Daily price is on bullish market condition located to be above Ichimoku cloud and Senkou Span line which is the border between the primary ebarish and the primary bullish trend on the chart. The price is ranging within the following narrow key support/resistance levels:
Chinkou Span line is above the price for the ranging bullish market condition, and Absolute Strength indicator is estimating the ranging condition to be continuing.
If D1 price will break 1.1326 support level on close bar so the local downtrend as the secondary correction within the bullish market condition will be started.
If D1 price will break 1.1453 resistance level on close bar from below to above so the bullish trend will be continuing.
If D1 price will break 1.1168 support level on close bar so the reversal of the price movement from the primary bullish to the primary bearish market condition will be started with the secondary ranging.
If not so the price will be on ranging within the levels.
SUMMARY : bullish
TREND : rangingForum on trading, automated trading systems and testing trading strategies
Forecast for Q2'16 - levels for USD/JPY
Sergey Golubev, 2016.04.10 13:09
Quick Technical Overview - Sell USD/JPY: bearish breakdown
USD/JPY: bearish breakdown. The price is located to be below 100-day SMA and 200-day SMA for the primnary bearish market condition: the price is on breakdown with 107.67 support level as the tager for the bearish breakdown to be continuing if broken. Alternatively, if the price breaks 113.79 resistance level to above so the bear market rally will be started within the bearish condition with the good possibility to the reversal of the price movement to the primary bullish market condition if 117.51 resistance level will be broken to above.
There are the following news events which will be affected on USD/JPY price movement for the week:
Forum on trading, automated trading systems and testing trading strategies
Forecast for Q2'16 - levels for Hang Seng Index (HSI)
Sergey Golubev, 2016.04.10 19:13
Hang Seng Index Technical Analysis 2016, 10.04 - 17.04: ranging within narrow reversal levels for direction
Daily price is located near SMA with period 100 (100 SMA) and below SMA with the period 200 (200 SMA) for the ranging within the narrow key reversed levels:
RSI indicator is estinating the possible bullish reversal in the future.
SUMMARY : ranging
TREND : waiting for reversalForum on trading, automated trading systems and testing trading strategies
Forecast for Q2'16 - levels for Bovespa Index
Sergey Golubev, 2016.04.10 19:42
Bovespa Index Technical Analysis 2016, 10.04 - 17.04: branging bullish with ascending triangle pattern to be formed for the bullish trend to be continuing
Daily price is located above 100-day SMA (100 SMA) and 200-day SMA (200 SMA) for the bullish market condition with the ranging within the following key support/resistance levels:
RSI indicator is estimating the bullish trend to be continuing.
SUMMARY : ranging
TREND : bullishForum on trading, automated trading systems and testing trading strategies
Press review
Sergey Golubev, 2016.04.11 07:14
AUD/USD Intra-Day Fundamentals: Australian Home Loans and 42 pips price movement
2016-04-11 01:30 GMT | [AUD - Home Loans]
if actual > forecast (or previous one) = good for currency (for AUD in our case)
[AUD - Home Loans] = Change in the number of new loans granted for owner-occupied homes.
==========
==========
AUD/USD M5: 42 pips price movement by Australian Home Loans news event :
Forum on trading, automated trading systems and testing trading strategies
Forecast for Q2'16 - levels for SILVER (XAG/USD)
Sergey Golubev, 2016.04.11 09:47
SILVER (XAG/USD) Technical Analysis 2016, 10.04 - 17.04: Buy Silver - bullish breakout with 16.12 as the nearest target
Daily price is located above Ichimoku cloud and above Senkou Span line which is the virtual border between the primary bearish and the primary bullish trend on the chart. The price broke symmetric triangle pattern to above for the bullish trend to be continuing in good breakout way with the nearest resistance level at 15.51 to be broken for the bullish breakout to be continuing.
The price is located within the folllowing key reversal support/resistance lines:
Chinkou Span line is located above the price for the bullish breakout to be continuing, and Absolute Strange indicator is evaluating the bullish trend on the near future.
If D1 price will break 14.77 support level on close bar so the reversal of the price movement from the ranging bullish to the primary bearish market condition will be started with 14.60 level to re-enter.
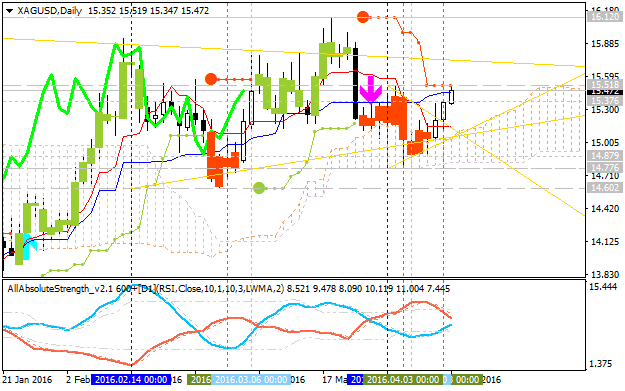
If D1 price will break 15.51 resistance level on close bar from below to above so the bullish breakout will be continuing with 16.12 as the nearest bullish target.
If not so the price will be on ranging within the levels.
SUMMARY : breakout
TREND : bullishForum on trading, automated trading systems and testing trading strategies
Forecast for Q2'16 - levels for DAX Index
Sergey Golubev, 2016.04.11 13:20
DAX Index Pivot Points Analysis - bearish ranging within Central Yearly Pivot and the First Support Pivot level
W1 price is located to be below yearly Central Pivot at 10,807 and above S1 Pivot at 9,190:
Trend:
Forum on trading, automated trading systems and testing trading strategies
Forecast for Q2'16 - levels for EUR/USD
Sergey Golubev, 2016.04.11 13:37
EUR/USD Intra-Day Technical Analysis - waiting for direction of the trend to break the levels
M5 price is located near SMA with period 100 (100 SMA) and SMA with the period 200 (200 SMA) waiting for the direction for the possible breakout in the case of the bullish trend or breakdown in case of the bearish trend to be started. RSI indicator is estimating the local uptrend to be continuing together with possible bullish reversal of the price movement.
SUMMARY : ranging
TREND : waiting for directionForum on trading, automated trading systems and testing trading strategies
Press review
Sergey Golubev, 2016.04.11 16:55
Forecast of Forecasters: the long-term forecasts for the banks shares prices (related to the banks which are making a long-term forex forecasts).
Many people know the banks which are making forecast for forex (for example - here). Those are very significal financial instituations, they are very well-known banks:
So, let's evaluate their shares - bearish or bullish?
=======
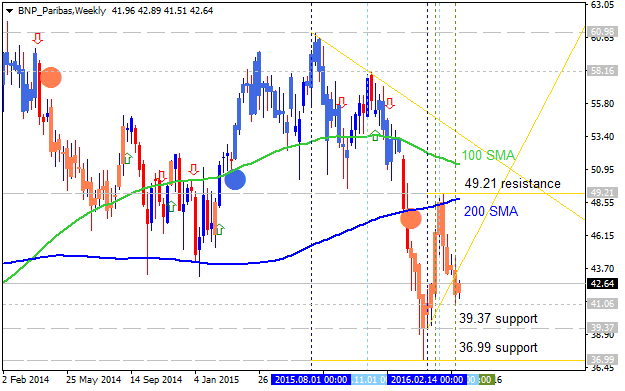
BNP Paribas: Long-term bearish condition with the secondary ranging. The shares price is located below 100/200 SMA ranging reversal area for the primary bearish market condition. The reversal resistance is located at 41.21 which is very far from the market price for now so the most likely scenarios are the following: the price breaks 39.37 support for the bearish trend to be continuing with 36.99 target, or the ranging bearish trend will be continuing.
=======
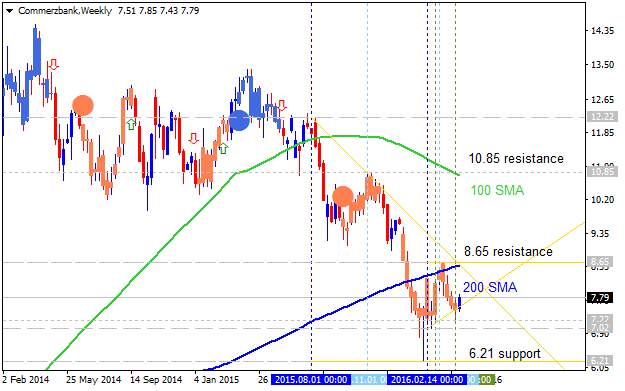
Commerzbank: Long-term bearish near ranging bullish reversal area. The price is located near and below 200 period SMA for the bearish market condition. Price is ranging within narrow s/r reversal levels: 6.21 support level for the bearish trend to be continuing, and 8.65 resistance level for the bullish reversal to be started. Symmetric triangle pattern was formed by the price to be crossed for direction, and RSI indicator is estimating the ranging bearish condition in the long term situation for the future.
=======
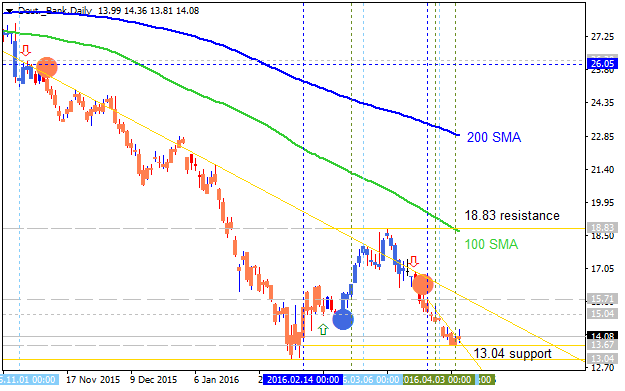
Deutsche Bank: Deep bearish in the long-term. Price is located far below 100 SMA/200 SMA reversal area on the weekly chart with descending triangle pattern to be formed for the bearish trend to be continuing. The most likely scenario is the support level at 13.04 to be broken to below, other wise the price will continuing with ranging within the primary bearish market condition. By the way, the bullish reversal resistance level is located at 18.83 which is too far from the market price and it makes the bullish reversal to be unlikely in 2016 for example.
=======
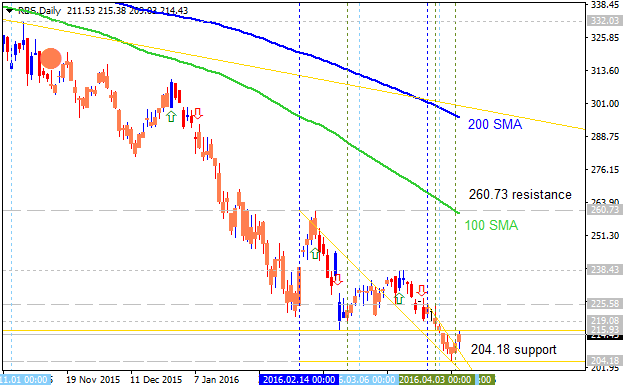
The Royal Bank of Scotland: Deep long-term bearish. The price is located to be far below 100/200 SMA reversal area with 204.18 support level to be testing for the bearish trend to be continuing. Bullish reversal resistance level is located at 260.73 which is too far for the price to be reversed to the primary bullish condition in this year for example.=======
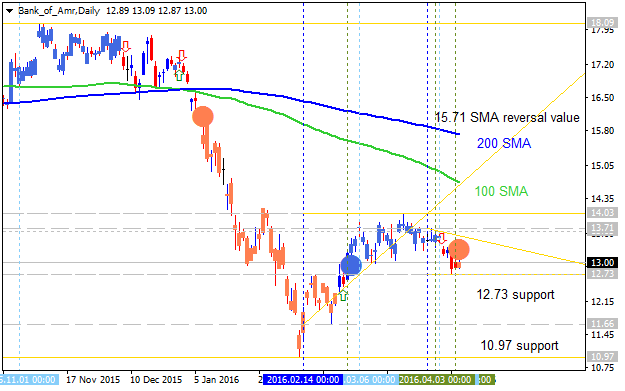
Bank of America Merrill Lynch: Long-term ranging bearish. The shares price is located below 100/200 SMA area for the primary bearish market condition. The bearish breakdown was started on the weekly open price with support level at 12.73 to be testing for the bearish trend to be continuing with 10.97 level as the next bearish target.=======
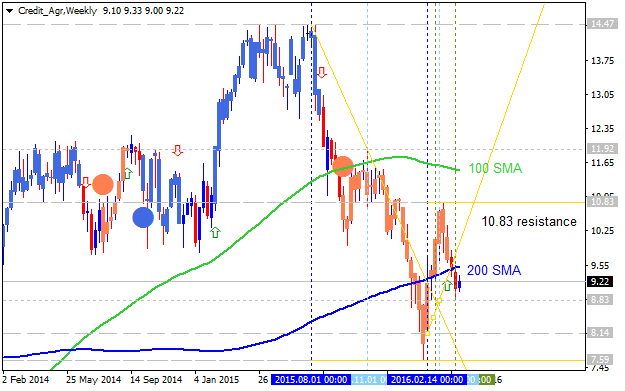
Credit Agricole: bearish reversal. The shares price is on the bearish reversal by breaking 200 SMA to below. If the price breaks 8.83 support on close weekly bar so the bearish trend will be started, if the price breaks 10.83 resistance level to above so the price will be reversed back to the bullish market condition.=======
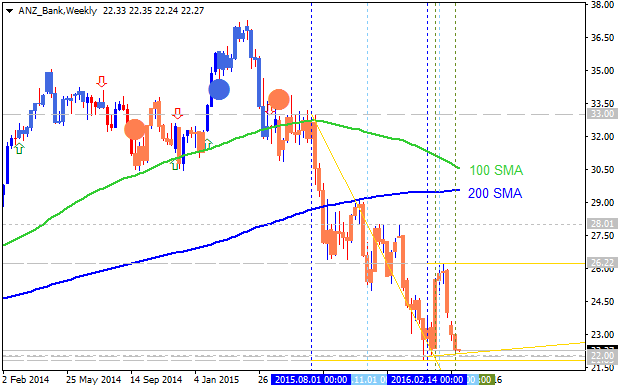
ANZ Bank: Long-term bearish breakdown. The price is on bearish breakdown by breaking 21.99 support level for the bearish trend to be continuing. The 100/200 SMA bullish reversal area is located to be too far for the price which makes the bullish reversal to be unlikely during this year.=======