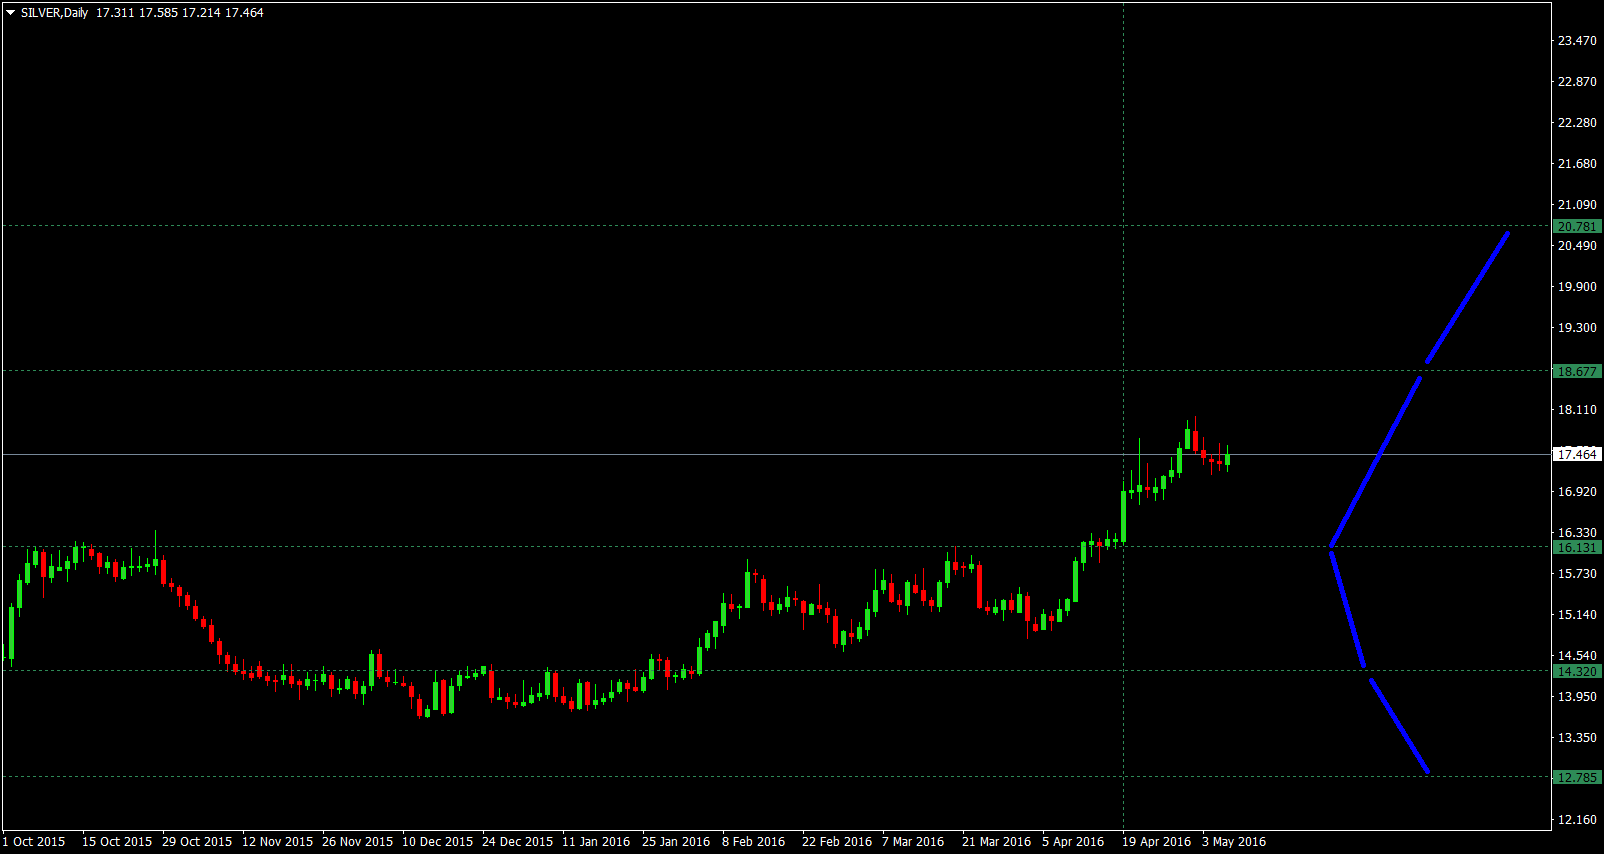
Forecast for Q2'16 - levels for SILVER (XAG/USD)
SILVER (XAG/USD) Technical Analysis 2016, 10.04 - 17.04: Buy Silver - bullish breakout with 16.12 as the nearest target
Daily price is located above Ichimoku cloud and above Senkou Span line which is the virtual border between the primary bearish and the primary bullish trend on the chart. The price broke symmetric triangle pattern to above for the bullish trend to be continuing in good breakout way with the nearest resistance level at 15.51 to be broken for the bullish breakout to be continuing.
The price is located within the folllowing key reversal support/resistance lines:
- 15.51 key resistance level located near and above Ichimoku cloud in the primary bullish area of the chart, and
- 16.12 key resistance level located far above Ichimoku cloud in the primary bullish area, and
- 14.77 key support level located near and below Ichimoku cloud on the border between the ranging bullish and the primary bearish area of the daily chart.
Chinkou Span line is located above the price for the bullish breakout to be continuing, and Absolute Strange indicator is evaluating the bullish trend on the near future.
If D1 price will break 14.77
support level on close bar so the reversal of the price movement from the ranging bullish to the primary bearish market condition will be started with 14.60 level to re-enter.
If D1 price will break 15.51
resistance level on close bar from below to above so the bullish breakout will be continuing with 16.12 as the nearest bullish target.
If not so the price will be on ranging within the levels.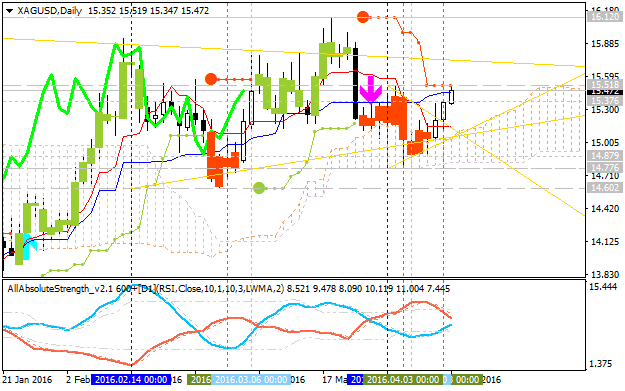
- Recommendation for long: watch close D1 price to break 16.12 for possible buy trade
- Recommendation
to go short: watch D1 price to break 14.77 support level for possible sell trade
- Trading Summary: bullish breakout
| Resistance | Support |
|---|---|
| 15.51 | 14.77 |
| 16.12 | 14.60 |
SUMMARY : breakout
Forecast for Tomorrow - levels for SILVER (XAG/USD)
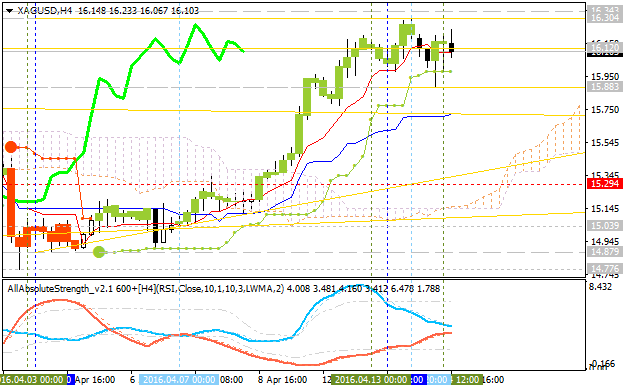
XAG/USD: intra-day bullish ranging within narrow levels waiting for breakout/breakdown. The price is located far above Ichimoku cloud in the bullish area of the chart: price is on ranging within narrow s/r levels for the bullish trend to be continuing or to the secondary correction to be started.
- if the price
breaks 16.30 resistance so the bullish trend will be continuing;
- if the price breaks 15.88 support level so the secondary correction withn the primary bearish condition will be started with 15.75 level as a target;
- if not so the price will be moved within the channel.
| Resistance | Support |
|---|---|
| 16.30 | 15.88 |
| N/A | 15.75 |
SILVER: End Of Week Technicals - Ranging Bullish or Bullish Breakout?
Daily price
is on daily bullish breakout with 17.67 resistance level to be broken for the bullish trend to be continuing.
If the price breaks 16.35
support level so the local downtrend as the secondary correction will be started.
If the price breaks 14.77 support level so the reversal of the price movement from the primary bullish to the primary bearish market condition will be started.
If the price breaks 17.67
resistance level so the bullish trend will be continuing.
If not so the price will be ranging within the levels.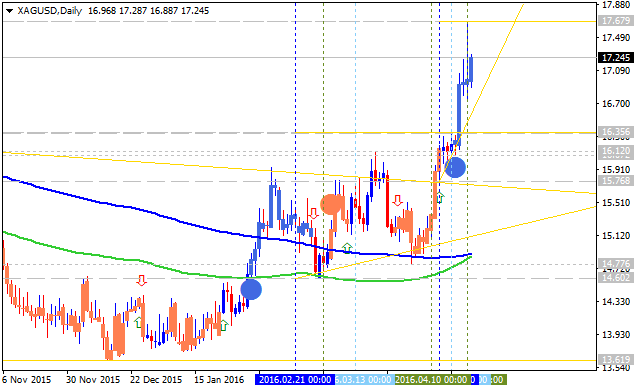
- Recommendation for long: watch close the price to break 17.67 for possible buy trade
- Recommendation
to go short: watch the price to break 16.35 support level for possible sell trade
- Trading Summary: bullish
| Resistance | Support |
|---|---|
| 17.67 | 16.35 |
| N/A | 14.77 |
SUMMARY : bullish
SILVER (XAG/USD) Daily Price Action Analysis - ranging bullish with 50.0% Fibo support level at 16.23 to be broken for correction
D1 price is located above 200 period SMA (200 SMA) and above 100 period SMA (100 SMA) for the primary bullish market condition with the ranging within the follwing key support/resistance levels:
- Fibo resistance level at 17.68 located far above 100 SMA/200 SMA in the primary bullish area of the chart, and
- 50.0% Fibo support level at 16.23 located in the beginning of the secondary correction area.
If the price will break 50.0% Fibo support level at 16.23 so we may see the ranging correctional
movement within the primary bullish market condition.
If the price will break Fibo resistance level at 17.68 from below to above so the primary bullish trend will be continuing with good possible breakout of the price movement.
If not so the price will be ranging within the levels.
| Resistance | Support |
|---|---|
| 17.68 | 16.23 |
| N/A | N/A |
- Recommendation for long: watch close price to break 17.68 for possible buy trade
- Recommendation
to go short: watch price to break 16.23 support level for possible sell trade
- Trading Summary: bullish
SUMMARY : bullish
SILVER (XAG/USD) Technical Analysis 2016, 08.05 - 15.05:
- daily ranging with 17.94 key bullish continuination level;
- weekly bullish breakout with 17.94 nearest target to re-enter;
- monthly bear market rally to be started if 17.94 level to be broken.
Daily price is on bullish market condition located above Ichimoku cloud and above Senkou Span line which is the virtual border between the primary bearish and the primary bullish trend on the chart. The price was bonced from 17.94 resistance level for the ranging condition to be started within 17.94/16.81 levels. Absolute Strength indicator is estimating the ranging bullish condition, and Chinkou Span line is located above the price for the bullish trend to be continuing by direction.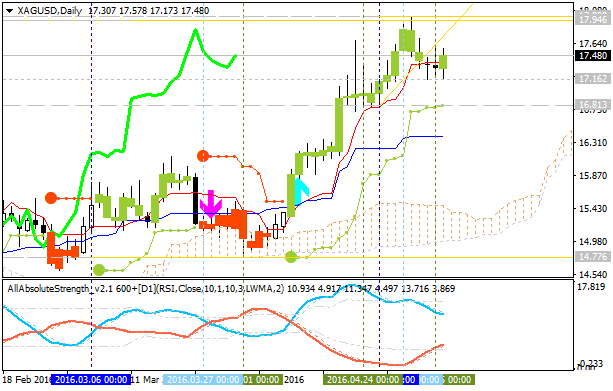
If D1 price will break 16.81
support level on close bar so the local downtrend as the daily
secondary correction within the primary bullish market condition will be
started.
If D1 price will break 17.94
resistance level on close bar so the bullish trend will be continuing without ranging.
If not so the price will be on ranging within the levels.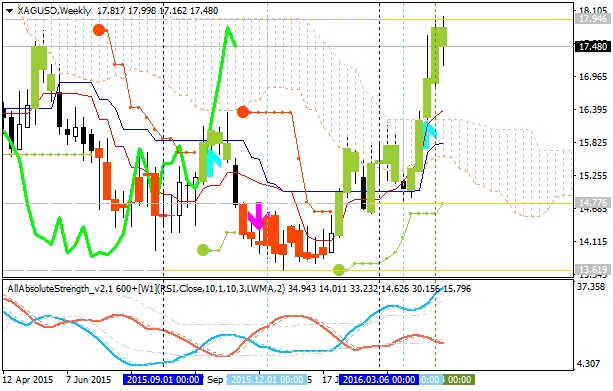
Weekly price is on bullish breakout: the price is testing 17.94 resistance level for the breakout to be continuing, otherwise - ranging bullish.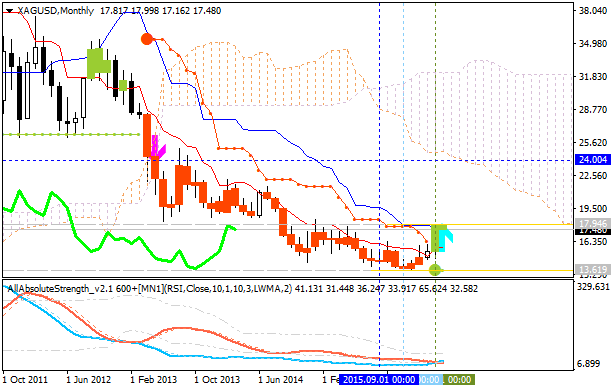
Monthly price is local uptrend as a market rally within the primary bearish market condition: the resistance level at 17.94 will be going to be broken for the rally to be continuing.
- Recommendation for long: watch close D1 price to break 17.94 for possible buy trade
- Recommendation
to go short: watch D1 price to break 16.81 support level for possible sell trade
- Trading Summary: correction to bearish reversal
| Resistance | Support |
|---|---|
| 17.94 | 16.81 |
| N/A | 14.77 |
SUMMARY : daily ranging bullish; weekly bullish breakout; monthly bear market rally
Good aft!
What you think?;)
Good aft!
What you think?;)
That's good analysis on your chart :)
- if daily price breaks resistance on close bar so - up
- if the price breaks support level - down.
Forum on trading, automated trading systems and testing trading strategies
Sergey Golubev, 2016.05.14 10:11
Forex Weekly Outlook May 16-20 (the source)
The US dollar had another positive week, enjoying some good data. UK and US inflation data, housing figures and most importantly the FOMC Meeting Minutes stand out. These are the highlights of this week.
- UK inflation data: Tuesday, 8:30. CPI in the UK is expected to rise by 0.5% in April.
- US Building Permits: Tuesday, 12:30. The number of building permits is expected to rise to 1.13 million-unit pace.
- US inflation data: Tuesday, 12:30. CPI is forecasted to rise 0.4% while core prices are estimated to climb 0.2% this time.
- UK employment data: Wednesday, 8:30. The amount of people receiving jobless benefits is expected to rise by 4,100 in April.
- US Crude Oil Inventories: Wednesday, 14:30. The EIA expects Brent to trade at $76 a barrel in the next year on continued increase in demand.
- US FOMC Meeting Minutes: Wednesday, 18:00. These are the meeting minutes from the April decision, in which the Fed left policy unchanged, acknowledged some improvement but did provide any hike hints. The chances for a rate hike in June dropped after that meeting but since then, data has improved. So, this is an opportunity for the Fed to hint about raising rates in June, if this is indeed the case, and it’s quite unclear that this a real option for the doves that control the Fed. It is important to remember that the minutes are edited until the last moment, allowing the Fed to sharpen any message.
- Australian employment data: Thursday, 1:30. Australia’s job market is expected to register 12,300 jobs addition, while the unemployment rate is expected to rise to 5.8% this time.
- US Philly Fed Manufacturing Index: Friday, 12:30. The ndex is expected to improve to 3.2 in May.
- US Unemployment Claims: Thursday, 12:30. Jobless claims are estimated to reach 276,000 this week.
- US Existing Home Sales: Friday, 14:00.
Forum on trading, automated trading systems and testing trading strategies
Sergey Golubev, 2016.05.19 19:16
SILVER (XAG/USD) Intra-Day Price Action Analysis (based on the article)
- "Yesterday evening, silver prices slipped below the April 25 low of $16.78 after the publication of a more hawkish than expected FOMC minutes release."
- "Concerning GDP, we already know that it may pick up, as the Atlanta Fed’s GDP now-cast model projects a rise of 2.5 % (seasonally adjusted annual rate). In regards to the other variables, it appears that the markets expect labor to remain strong and for inflation to rise, given the increased likelihood of a June rate hike."
- "A potentially short-term resistance level is the April 25 low of $16.78, which previously acted as a support but which may now turn into resistance. The short-term trend will remain bearish below the intraday high of $17.15 formed on May 18 and a few hours before the publication of the Fed minutes. The trend is bearish in the short-term, as prices have been creating lower lows and lower highs since May 16. The high preceding the $17.15 high is the May 17 high of $17.32."
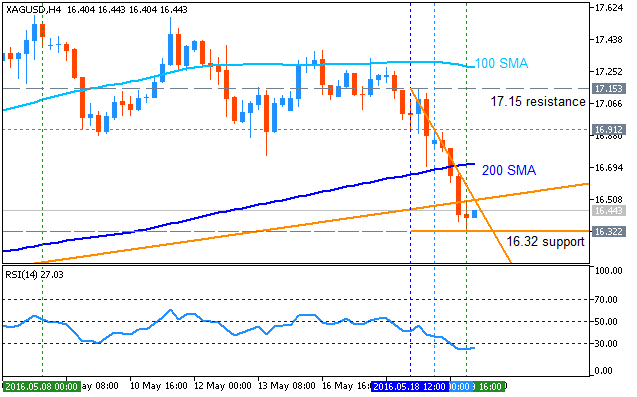
H4 price is on breakdown with the bearish reversal: the price broke 200 period SMA to below for the reversal of the intra-day price movement from the ranging bullish to the primary bearish market condition.
- The price is testing 16.32 support level for the bearish breakdown to be continuing,
- otherwise - we may see the ranging trend for the waiting for direction.
- Alternatively, if the price breaks 17.15 resistance level to above so the price will be started with the reversal back to the primary bullish market condition.
| Resistance | Support |
|---|---|
| 16.91 | 16.32 |
| 17.15 | N/A |
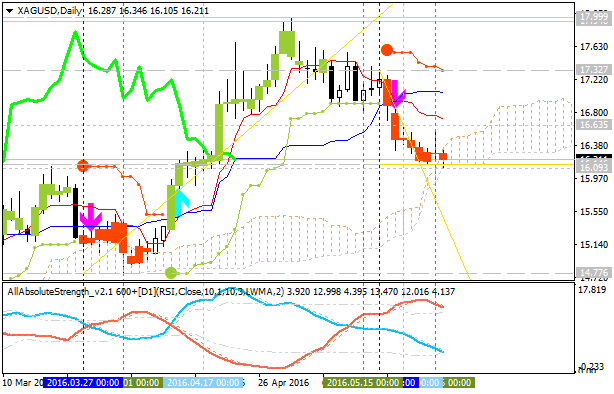
SILVER (XAG/USD) Technical Analysis 2016, 29.05 - 05.06: breaking 16.09 support level to the bearish reversal
Daily price is located near and above Senkou Span line which is the virtual border between the primary bearish and the primary bullish trend on the chart: price is testing Senkou Span together with 16.09 support level to below for the bearish reversal to be started. Absolute Strength indicator is estimating the the ranging condition to be continuing, and Chinkou Span line broke the price to below on open daily bar for the possible bearish reversal in the near future.
If D1 price will break 16.09
support level on close bar so the reversal of the price movement from the primary bullish to the primary bearish market condition will be started.
If D1 price will break 17.99
resistance level on close bar from below to above so the bullish trend will be continuing.
If not so the price will be on ranging within the levels.
- Recommendation for long: watch close D1 price to break 17.99 for possible buy trade
- Recommendation
to go short: watch D1 price to break 16.09 support level for possible sell trade
- Trading Summary: ranging
| Resistance | Support |
|---|---|
| 17.32 | 16.09 |
| 17.99 | 14.77 |
SUMMARY : ranging to bearish reversal
- Free trading apps
- Over 8,000 signals for copying
- Economic news for exploring financial markets
You agree to website policy and terms of use
Quick Technical Overview - SILVER (XAG/USD): correction to the bearish reversal
Daily price was on daily breakdown started in October last year: the price broke 100/200 SMA ranging area to below for the bearish reversal with the secondary ranging which was started in the end of 2015 together with the local uptrend as the bear market rally. The price was reversed back to the bullish condition in the beginning of 2016 by the breaking 100/200 SMA ranging area to above together with key resistance levels. For now - the price is on bullish market condition with the secondary ranging within the following key reversal s/r levels:
- 16.12 key resistance level located far above 100/200 SMA in the primary bullish area of the daily chart, and
- 14.77 key support level located near 200-day SMA in the beginning of the bearish area.
RSI indicator is estimating the secondary correction to be continuing with the possible bearish reversal.If the price breaks 14.77 support level so the reversal of the price movement from the primary bullish to the primary bearish market condition will be started.
If the price breaks 16.12 resistance level so the primary bullish trend will be continuing.
If not so the price will be ranging within the levels.
SUMMARY : bullish (possible reversal to the bearish)
TREND : correction