Forecast and Levels for Bovespa Index
Bovespa Index Pivot Points Analysis - breaking key resistance to R1 level as a target
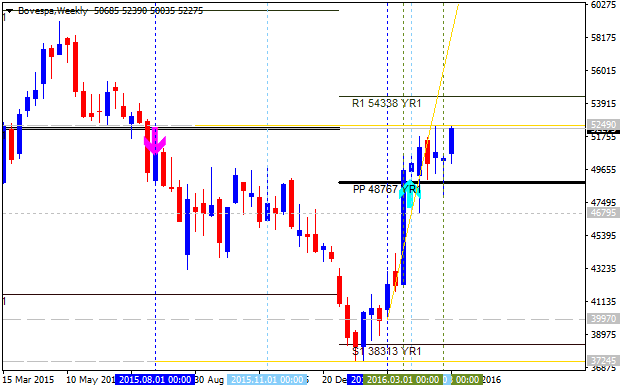
W1 price broke Central yearly Pivot at 48767 for the primary bullish market condition: the price is bearish 52490 resistance level for the bullish trend to be continuing with R1 level at 54338 as the next bearish target.
| Instrument | S1 Pivot | Yearly PP | R1 Pivot |
|---|---|---|---|
| Bovespa Index | 38313 |
48767 |
54338 |
Trend:
- W1 - bullish
Bovespa Index Technical Analysis 2016, 17.04 - 24.04: bullish ranging with narrow levels
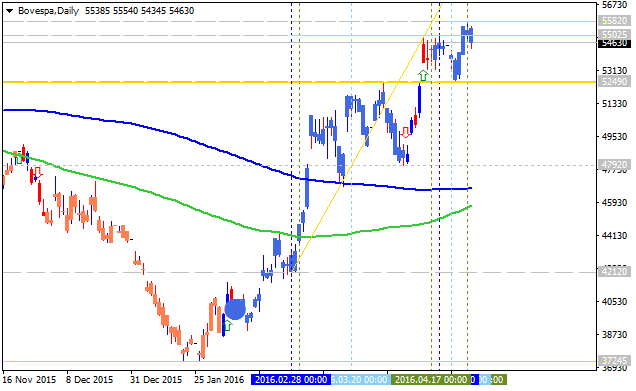
H4 price is on bullish market condition located to be above Ichimoku cloud in the primary bullish area of the chart. The price is on ranging within narrow support/resistance levels for the bullish trend to be continuing or to the secondary correction to be started.
Chinkou Span line is above the price for the ranging bullish by direction, and Absolute Strange indicator is evaluating the price movement as the secondary ranging condition to be continuing.
If H4 price will break 53,185
support level on close bar so the local downtrend as the secondary correction within the primary bullish condition will be started.
If H4 price will break 54,895
resistance level on close bar from below to above so the primary bullish trend will be continuing.
If not so the price will be on ranging within the levels.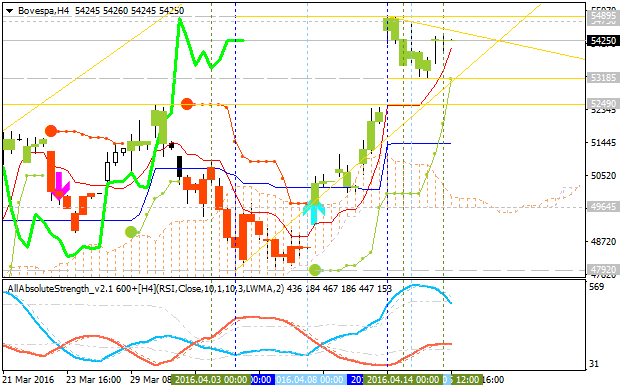
- Recommendation for long: watch close D1 price to break 54,895 for possible buy trade
- Recommendation
to go short: watch D1 price to break 53,185 support level for possible sell trade
- Trading Summary: bearish rally to the bullish reversal
| Resistance | Support |
|---|---|
| 54,895 | 53,185 |
| N/A | 52,490 |
SUMMARY : ranging
Forum on trading, automated trading systems and testing trading strategies
Market Condition Evaluation based on standard indicators in Metatrader 5
Sergey Golubev, 2016.04.29 13:18
USD/RUB (Russia) is at 5-month low: 64.15
GBP/USD (The UK) is at 3-month high: 1.4638
USD/JPY (Japan) is at 7-month low: 107.00
USD/CAD (Canada) is at 9-month low: 1.2504
NZD/USD (New Zealand) is at 10-month low: 0.6988
USD/TRY (Turkey) is at 8-month low: 2.8050
Bovespa Index (Brazil) is at 10-month high
Apple Shares is at 10-month low: 96.50
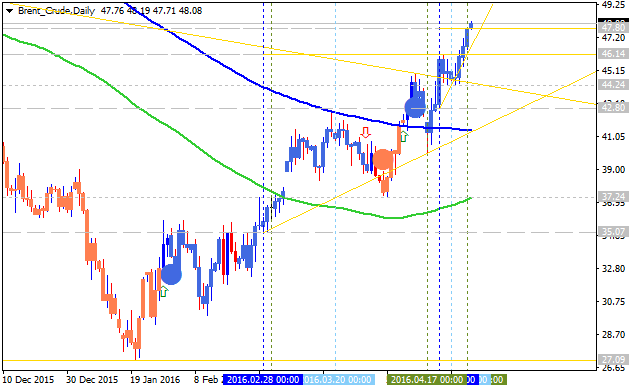
Brent Crude Oil is at 5-month high: 47.80
Hi Sergey, great analysis here.
As you must know, all this Bovespa Index movement is mainly caused by the expectation of impeachment of the President of Brazil.
I know this is a fundamental information and off topic, but only to think of the cause and effect relationship, next week and first half of May we will have important decisions of the Brazilian Senate that will impact further on that strength.
Best Regards.
Any expetation is good (expectation for impeachment, and expectation against it) if it is helping to turn the Country Index to the global bullish market condition :)
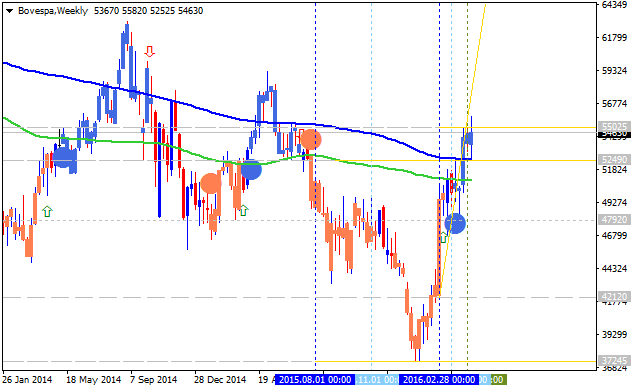
Yes, I know that. But the Index was turned to the primary bullish in the medium-term situation (D1 timeframe), and it was turned to the bullish (for the 3rd time sorry) in the long-term for W1 timeframe.
Any expetation is good (expectation for impeachment, and expectation against it) if it is helping to turn the Country Index to the global bullish market condition :)
For sure, in my opinion reach 60.000 points will be decisive to indicate this alignment with global busllish movement and MN1 timeframe (below) can be more useful now for such analysis.

Yes, that's right - monthly timeframe is the better in this case.
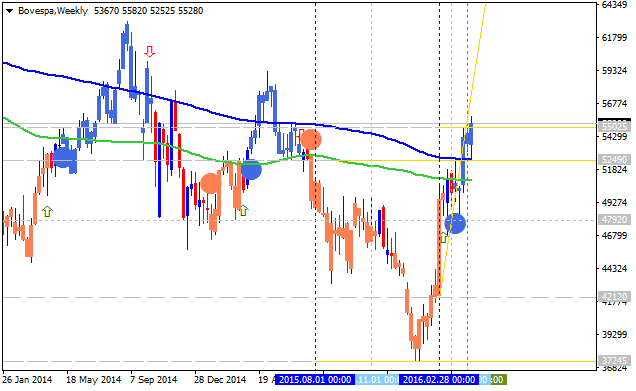
If we analyse it using simple moving averages (by 100 period SMA and by 200 period SMA) so the price is still inside the ranging condition waiting for direction:
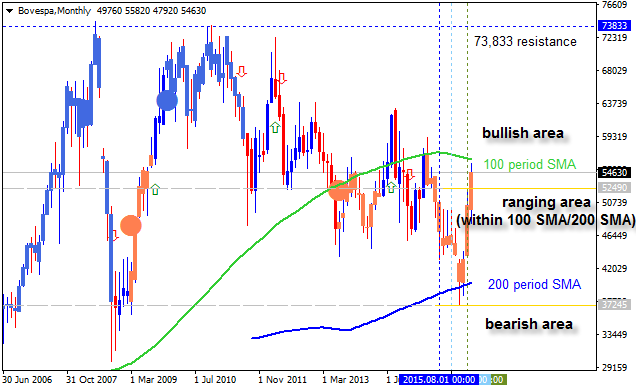
If we look at Ichimoku monthly chart so we see about breakout to be started on open monthly bar (Chinkou Span is breaking the price to above), and the price is breaking 'reversal' Senkou Span on open bar as well.
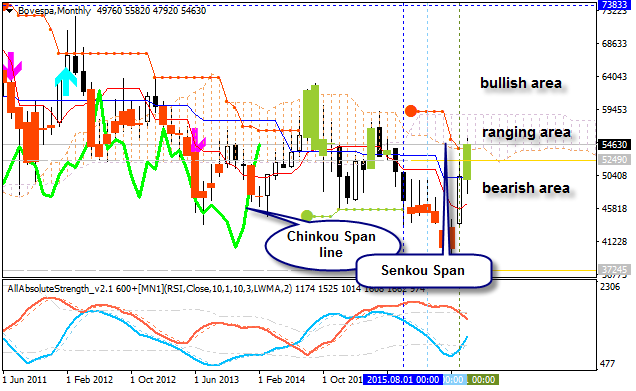
So, the monthly price is still on the ranging condition with the good tendency/possibility for the bullish reversal in the next few months for example.
Yes, that's right - monthly timeframe is the better in this case.
If we analyse it using simple moving averages (by 100 period SMA and by 200 period SMA) so the price is still inside the ranging condition waiting for direction:
If we look at Ichimoku monthly chart so we see about breakout to be started on open monthly bar (Chinkou Span is breaking the price to above), and the price is breaking 'reversal' Senkou Span on open bar as well.
So, the monthly price is still on the ranging condition with the good tendency/possibility for the bullish reversal in the next few months for example.
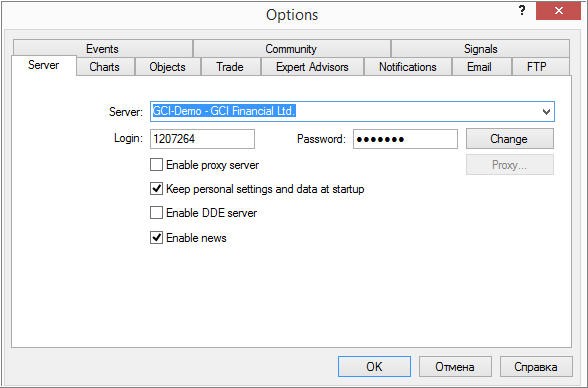
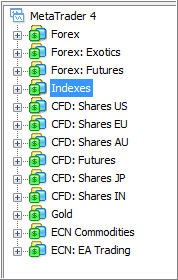
I know nothing about them but I tried to find something after Alpari removed the most of the indicatives and shares so I had to find some server in MT4 which is providing indexes and shares.
I did not install new MT4 instance - I just used same one - i opened demo account by searching new server inside same MT4 instance.
It may be good to have indexes and shares in MT5 because in my opinion - MT5 is more suitable for technical analysis for example (MT4 is more used for trading for now).
Because you know ... there are a lot of good technical/fundamental analysis for some shares (for Apple etc), etc ... but they are using some strange platforms or websites with "web platform" (not web terminal - we are having web terminal here ... they are using some "web platforms" just to look at some price (our web terminal is for trading too so ...).
So, my dream is the following: why do I need to go to some other "data sources"/"web platforms" just to create some technical analysis for something?
I think - everything should be here as MT4 and/or MT5 for example.
Because what is the technical analysis?
- any technical analysis can be 'transformed' onto pending orders ... so it may be some signals but for one trade in a week/month as a pending orders for buy or sell for example (just for example only)/ Of course, no one will be interested in buy stop and sell stop orders delivered once in a week/month as the signal ... but if we are talking about technical analysis so this is completely an other science/service/profession ... i mean - any technical analysis is some advice for real investors for example.
- good developed technical analysis system = trading system
- manual trading system based on good developed technical analysis system = good automatic trading system (some EA for example)
- investing opportunities, and so on
Because what is the Forbes doing (why they are very popular one)? They are doing the following:
- they are evaluating some index (S&P 500, or any) - bearish, bullish, or whatever;
- they are estimating the shares which can be the engines for bearish and the engines for bullish (within same index);
- after that - they are making some recommendations for the investors concerning what to buy and what to sell (shares) now.
If we can do it using just Metatrader only (and just one Metatrader instance' installation) so it will be very good.
- Free trading apps
- Over 8,000 signals for copying
- Economic news for exploring financial markets
You agree to website policy and terms of use
Bovespa Index Technical Analysis 2016, 10.04 - 17.04: branging bullish with ascending triangle pattern to be formed for the bullish trend to be continuing
Daily price is located above 100-day SMA (100 SMA) and 200-day SMA (200 SMA) for the bullish market condition with the ranging within the following key support/resistance levels:
RSI indicator is estimating the bullish trend to be continuing.
SUMMARY : ranging
TREND : bullish