Gold System
Forum on trading, automated trading systems and testing trading strategies
Sergey Golubev, 2014.02.22 07:22
How to Trade Gold Yearly Pivot Points (adapted from dailyfx article)
- Commodity pit traders have used pivot points for decades to determine potential support and resistance areas.
- Gold yearly pivot points from 2013 forecasted significant turning points
- Gold is approaching the 2014 central yearly pivot point at 1360.82
The year 2013 was not very kind to the shiny metal. Gold plunged 27% or just over $450/oz. in one of the biggest declines in many years. However, after hitting a three year low of 1178.86 back in December 2013, gold has managed to crawl back higher in 2014.Yearly pivots marked gold's decline with pinpoint accuracy.
Gold 2013 Yearly Pivots :
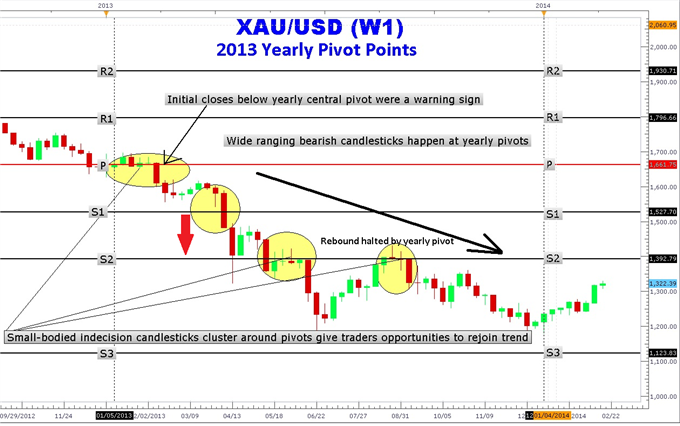
The sudden and severe $141/oz. drop in gold in the beginning of 2013
caught many gold traders off guard. However, traders who watched gold
yearly pivots knew ahead of time that a close below the central pivot
(P) at $1661.75/oz.
Notice in the chart above how price hugged the central pivot red line.
The close below the yearly central pivot marked the beginning of a
year-long decline to 3-year lows.
Even after reaching a low of 1208, the subsequent gold rally in July was
stopped dead in its tracks at the S2 yearly pivot at $1392.79/oz. Gold
went on to make the low of the year at 1179.86. Yearly pivots were
useful for determining the beginning of the decline as well as locating
areas to re-enter or add more to a position. You may now be wondering
what the 2014 yearly pivots have in store for gold.
Gold 2014 Yearly Pivots :
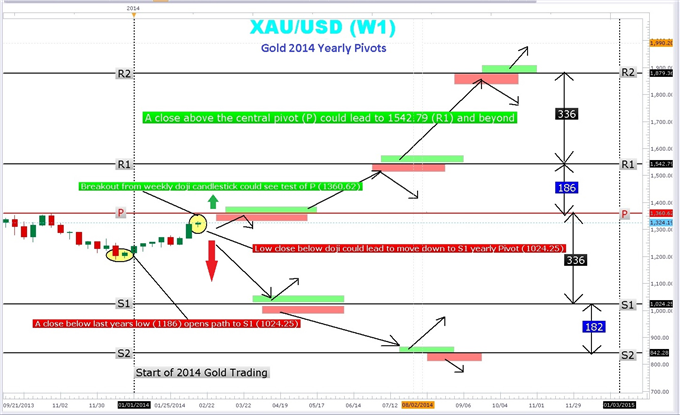
Gold Yearly Pivot Trading Plan
Gold starts 2014 higher than where it left off in 2013. Crossing above
the psychologically important $1300 level, gold is a long way from the
lofty highs in the $1900 area. The first major yearly pivot hurdle is
just $40.00 away at the central yearly pivot at 1360.82. This was also
the highs of October 2013. Pivot points often act as magnets “pulling”
price up or down to the nearest pivot.
The current weekly Japanese candlestick pattern is an indecision
doji/spinning top. This gives us a “fork in the road” or decision point;
price could break higher or lower from this point and continue to trend
in the breakout direction. A new candle is due out next Monday and if
it can break above the 1332 high of the doji candle could lead to an
explosive move toward the R1 pivot and beyond. Moves above the central
pivot are regarded as bullish.
On the other hand, a break below 1307.26 low of the weekly doji candle
opens move toward the lows of 2013 in the 1186 area and a test of the S1
yearly pivot at 1024.25. Remember that yearly pivots represent
potential support and resistance. Using the pivot point calculation on
the high low and close of 2013, these levels can be created. Yearly
pivot levels can help traders determine price targets for taking profit
as well as entry and stop areas.
Forum on trading, automated trading systems and testing trading strategies
Something Interesting in Financial Video July 2013
Sergey Golubev, 2013.07.13 19:50
Trading the Gold Silver Ratio :
For the hard-asset enthusiast, the gold-silver ratio is part of common parlance, but for the average investor, this arcane metric
is anything but well-known. This is unfortunate because there's great
profit potential using a number of well-established strategies that rely
on this ratio.
In a nutshell, the gold-silver ratio represents the number of silver ounces it takes to buy a single ounce of gold. It sounds simple, but this ratio is more useful than you might think. Read on to find out how you can benefit from this ratio.
How the Ratio Works
When gold trades at $500 per ounce and silver at $5, traders refer to a gold-silver ratio of 100. Today the ratio floats, as gold and silver are valued daily by market forces, but this wasn't always the case. The ratio has been permanently set at different times in history - and in different places - by governments seeking monetary stability.
Here's a thumbnail overview of that history:
- 2007 – For the year, the gold-silver ratio averaged 51.
- 1991 – When silver hit its lows, the ratio peaked at 100.
- 1980 – At the time of the last great surge in gold and silver, the ratio stood at 17.
- End of 19th Century – The nearly universal, fixed ratio of 15 came to a close with the end of the bi-metallism era.
- Roman Empire – The ratio was set at 12.
- 323 B.C. – The ratio stood at 12.5 upon the death of Alexander the Great.
How to Trade the Gold-Silver Ratio
First off, trading the gold-silver ratio is an activity primarily undertaken by hard-asset enthusiasts like "gold bugs". Why? Because the trade is predicated on accumulating greater quantities of the metal and not on increasing dollar-value profits. Sound confusing? Let's look at an example.
The
essence of trading the gold-silver ratio is to switch holdings when the
ratio swings to historically determined "extremes." So, as an example:
- When a trader possesses one ounce of gold, and the ratio rises to an unprecedented 100, the trader would then sell his or her single gold ounce for 100 ounces of silver.
- When the ratio then contracted to an opposite historical "extreme" of, say, 50, the trader would then sell his or her 100 ounces for two ounces of gold.
- In this manner, the trader would continue to accumulate greater and greater quantities of metal, seeking "extreme" ratio numbers from which to trade and maximize his or her holdings.
For those worried about devaluation, deflation,
currency replacement - and even war - the strategy makes sense.
Precious metals have a proven record of maintaining their value in the
face of any contingency that might threaten the worth of a nation's fiat currency.
Drawbacks of the Trade
The obvious difficulty with the trade is correctly identifying those "extreme" relative valuations between the metals. If the ratio hits 100 and you sell your gold for silver, then the ratio continues to expand, hovering for the next five years between 120 and 150, you're stuck. A new trading precedent has apparently been set, and to trade back into gold during that period would mean a contraction in your metal holdings.
What is there to do in that case? One could always continue to add to one's silver holdings and wait for a contraction in the ratio, but nothing is certain. This is the essential risk to those trading the ratio. It also points out the need to successfully monitor ratio changes over the short and medium term in order to catch the more likely "extremes" as they emerge.
Conclusion
There's an entire world of investing permutations available to the gold-silver ratio trader. What's most important is to know one's own trading personality and risk profile. For the hard-asset investor concerned with the ongoing value of his or her nation's fiat currency, the gold-silver ratio trade offers the security of knowing, at the very least, that he or she always possesses the metal.
Forum on trading, automated trading systems and testing trading strategies
Sergey Golubev, 2018.07.13 08:42
Crude Oil - oil/gold price ratio (based on the article)


- "When taking a glance at the performance of investments in stocks, currencies, and commodities -- which is compiled by the Wall Street Journal for the second quarter of 2018 -- one is struck by the fact that all of the top five performers were commodities. Lean hogs took the top honors, followed by crude oil."
- "Crude’s position didn’t surprise me. Way back in February 2016 -- when West Texas Intermediate (WTI) was trading at $26/bbl. -- I was confident that crude oil would make a relentless climb. How could I have been so confident then, and confident now, that today’s WTI price of $69.50/bbl. will climb to $75/bbl. by year’s end?"
- "To answer these questions, we must have a model -- a way of thinking about the problem. In this case, the starting point is Roy W. Jastram’s classic study, The Golden Constant: The English and American Experience 1560-2007. In that work, Jastram finds that gold maintains its purchasing power over long periods of time, with the prices of other commodities adapting to the price of gold."
- "In support of this model, it is worth pointing out that a free-market economic system is an organism, and operates as such. Each organism is organized to maintain a certain “state” of homeostatis, to borrow a term from physiology. Any disturbance from the equilibrium sets in motion behavior within the organism which tends to re-establish the desired state of equilibrium. For example, the human body has a complex physiochemical equilibrium, which involves, among other things, a constant body temperature. If the equilibrium is disturbed, the body acts to restore the homeostatis or equilibrium."
==========
Chart was made on MT5 with Brainwashing system/AscTrend system (MT5) from this thread (free to download) together with following indicators:
- MaksiGen_Range_Move MTF - indicator for MetaTrader 5
- ASCtrend - indicator for MetaTrader 5
- Ichimoku Cloud - indicator for MetaTrader 5
- Quick ZigZag plus DiNapoli - indicator for MetaTrader 5
- GMMA - indicator for MetaTrader 5
- Vortex - indicator for MetaTrader 5
==========
Same systems for MT4/MT5:
The beginning
- ASCTrend system, the beginning, part #1
- ASCTrend system, the beginning, part #2
- ASCTrend system, the beginning, part #3
- ASCTrend system, the beginning, part #4
- Digital ASCTrend (Digital Filters with ASCTrend system combined).
- LabTrend (LabTrend indicators, LabTrendZigZag, templates, Labtrend EAs) - the thread
After
- The main AscTrend thread is this one.
- Asctrend indicator in depth
- ASCTREND SYSTEM summary (good EAs included)
- Brainwashing system/AscTrend system (MT5) - the thread
- Free trading apps
- Over 8,000 signals for copying
- Economic news for exploring financial markets
You agree to website policy and terms of use