Dual Candle-stick Strategy
Here i found one entry of GBPUSD and it run with 100 pips

Besides, it may be good to have the template file for everybody here.
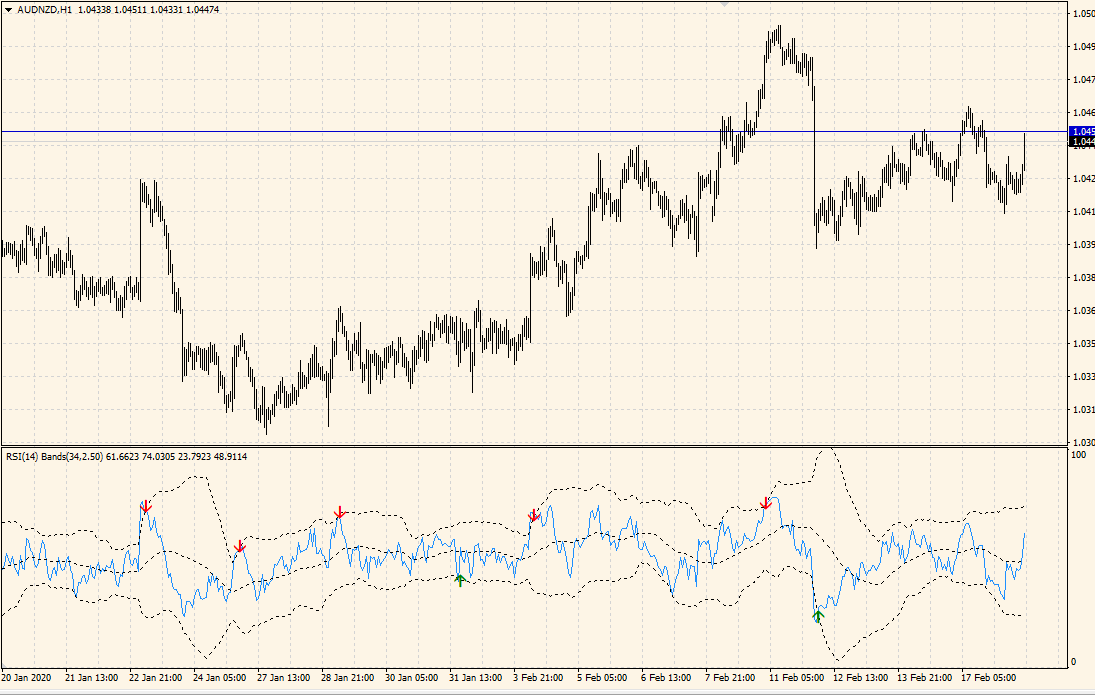
- RSI and Bollinger Bands - expert for MetaTrader 5
- RGT2 EA - expert for MetaTrader 4
- FullDump - expert for MetaTrader 5
- RSI Bollinger Bands EA - expert for MetaTrader 4
- Bollinger Bands RSI - expert for MetaTrader 5
- RSI vs BB - indicator for MetaTrader 4
- FullDump - expert for MetaTrader 4
- BBR - indicator for MetaTrader 4
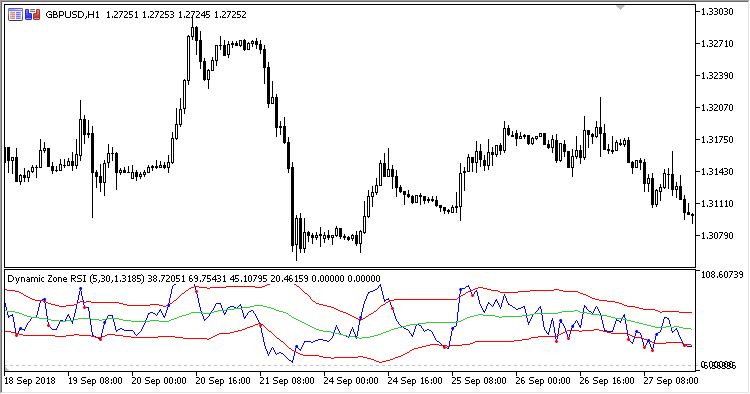
- Dynamic_Zone_RSI - indicator for MetaTrader 5
- RSI with BB - indicator for MetaTrader 4
- RSI with BB - indicator for MetaTrader 5
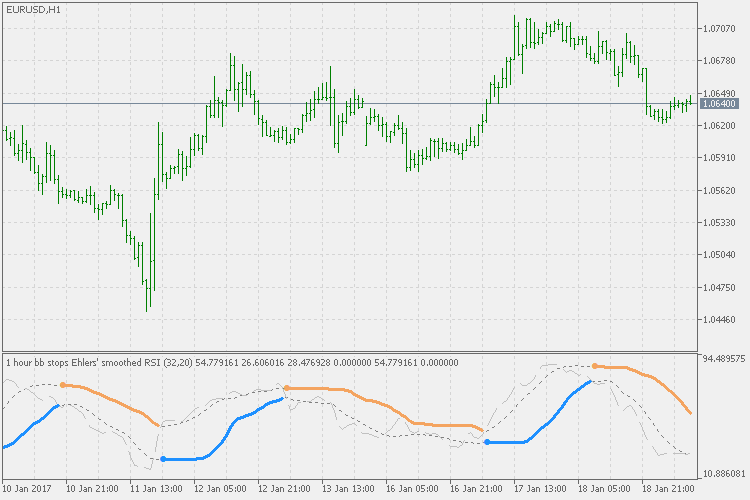
- BB stops - rsi - indicator for MetaTrader 5
- more here in search results links

- www.mql5.com
Use Metatrader please (we all here about Metatrader).
Besides, it may be good to have the template file for everybody here.
Ok next time i will show post metatrade chart and i will upload indicators file with template
Ok next time i will show post metatrade chart and i will upload indicators file with template
I'll wait. If it will be interesting to me, I will write a MQL5 trading strategy.
Here are links of template and indicators used for this strategy
Template ***
Indicator other than Bollinger band and RSI
***
***
Use:
- or standard indicators
- or indicators from CodeBase
First I like to visualize and change the standard indicators - so that these indicators become more visual. Here is an example of the 'Dual Candlestick strategy' template

on two indicators: Bollinger Bands Fills and RSI Fills.
First I like to visualize and change the standard indicators - so that these indicators become more visual. Here is an example of the 'Dual Candlestick strategy' template
on two indicators: Bollinger Bands Fills and RSI Fills.
yes its perfect
Since I like to visualize everything - the idea of the “ Dual Candlestick” indicator appeared - the DRAW_ARROWdrawing style. In order for the indicator to indicate the" Dual Candlestick" pattern on the chart- or rather, only the rightmost candle of the pattern.
In general, such an idea. I'll think about it ...


- www.investopedia.com
- Free trading apps
- Over 8,000 signals for copying
- Economic news for exploring financial markets
You agree to website policy and terms of use
Dual Candle-stick Strategy
My 4HR Dual Candlestick strategy is based on dual candlestick patterns in which the second candle is completely contained by the high and low of the first candle. Using two indicators for this strategy are
Bollinger Band (20,2, close)
RSI (14, close, Levels 30,50,70)
Long position
The first candlestick must be bullish (green or white) and if the second candlestick (either green or red) is completely contained by the first,
Both appear between upper and middle bands of Bollinger bands and,
RSI above 50 level.
Then set a buy-stop order. Use the high and low of the first candle for the calculation of buy-stop order.
Mostly i find both candle of same color
If the first candlestick is bullish (green or white) and the second candlestick is also green or white,
Both appear between upper and middle bands of Bollinger bands and
RSI above 50 level.
Then use the high and low of the first candle and put it into Google Spreadsheet it will calculate Entry price , Stop-Loss and Take-Profit.
Short position
The first candlestick must be bearish (red or black) and if the second candlestick (either red or green) is completely contained by the first,
Both appear between lower and middle bands of Bollinger bands and
RSI below 50 level.
then set a sell-stop order. Use the high and low of the first candle for the calculation of sell-stop order.
Mostly i find both candle of same color
If the first candlestick is bearish (red or black) and the second candlestick is also red or black
Both appear between lower and middle bands of Bollinger bands and
RSI below 50 level.
Then use the high and low of the first candle and put it into Google Spreadsheet it will calculate Entry price , Stop-Loss and Take-Profit.
Here are some examples for more clarification
US
Google Spreadsheet - Calculation of Entry Price, Stop Loss and Take Profits