Join our fan page
- Views:
- 32911
- Rating:
- Published:
- Updated:
-
Need a robot or indicator based on this code? Order it on Freelance Go to Freelance
Description:
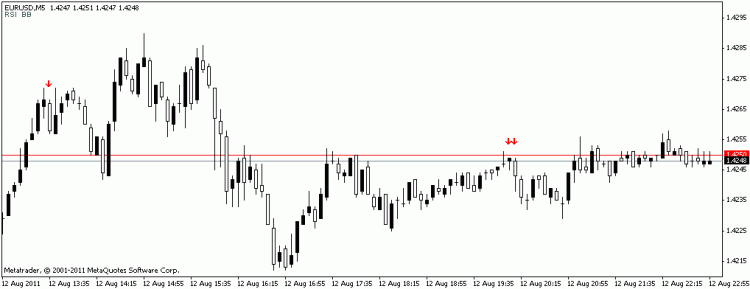
If price pierced upper or lower Bollinger Bands ®, RSI is overbought/oversold and moves back to 50 you'll get a signal.
Of course some false too, but as always MM and tight sl is the key. Recommended timeframe is M5. Added some objects that you are able to prepare for a signal.
RSI object gets orange when ob/os and changes to green or red when returns towards 50. BB object gets red or green when Bands were pierced.
If there is a higher high/lower low after a sell/buy signal and there is no new signal, RSI should show a divergence and you know what that means ;)
Happy pipping
 Statement To Chart
Just a simple script , that reads the HTML file a report , or detailed report , and draws a transaction from it on the chart
 GMail Reader using MQL and wininet
This script reads your unread GMail messages.
 LOC Kijun-Sen Channel
The channel indicator formed of 2 Kijun-Sen lines (Ichimoku system).
 Post-zigzag
The post-zigzag can count the moving of zigzag line. If see many continuous post on screen, It's will more signal for changing the trend of price.
