Bermaui Analysis - page 20
You are missing trading opportunities:
- Free trading apps
- Over 8,000 signals for copying
- Economic news for exploring financial markets
Registration
Log in
You agree to website policy and terms of use
If you do not have an account, please register
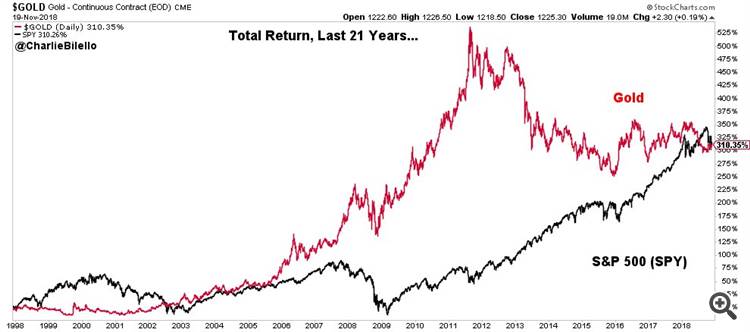
Total Return, Last 21 Years...
- Gold: +310%
- S&P 500: +310%
Amazon weekly graph touch the peak of its 160 bars linear regression channel, and diverge with momentum oscillator.
.
Amazon closed at its lowest level in 6 months, down 26% from its all-time high in September.
AUDJPY moves inside a Symmetrical Triangle (Coil pattern).
If the lower limit of the Coil is broken, it might target 81.5 Yen.
AUDJPY hit the target.
.
A perfect negative correlation between USDCAD & Oil.
Oil peak at 3 Oct 2018 is current USDCAD peak at 21 Nov 2018!
USDCAD bottom at 1 Oct 2018 is current Oil bottom at 21 Nov 2018!
.
NZDJPY H4 Chart. Head and Shoulder Pattern. target 75.5 yen.
.
Google Trends show that search for the word "Black Friday" is in a major uptrend.
.
NZDUSD moves inside a Falling Wedge pattern.
If break is to the upside, target will be 0.69 (next resistance).
If break is to the downside, target will be 0.67 (previous support).
Patience will payoff.
.
This one hour candlestick chart shows the short term extraordinary correlation between the Oil and the Dow Jones Average.
I this one of those two will decide the near future of the other.
.
NZDUSD moves inside a Falling Wedge pattern.
If break is to the upside, target will be 0.69 (next resistance).
If break is to the downside, target will be 0.67 (previous support).
Patience will payoff.
.
NZDUSD almost touched 0.6900
EURUSD cross the upper boundary of symmetrical triangle from above. Target is around 1.5500
.