Advanced trading lessons - page 55
You are missing trading opportunities:
- Free trading apps
- Over 8,000 signals for copying
- Economic news for exploring financial markets
Registration
Log in
You agree to website policy and terms of use
If you do not have an account, please register
i have been
the first step is to talk about a physical price channel by itself.
the next step is to add a higher time frame overlay on to the channel.
then the last thing to do is add a larger time frame higher yet to add the element of time to the equation.
so this is step one.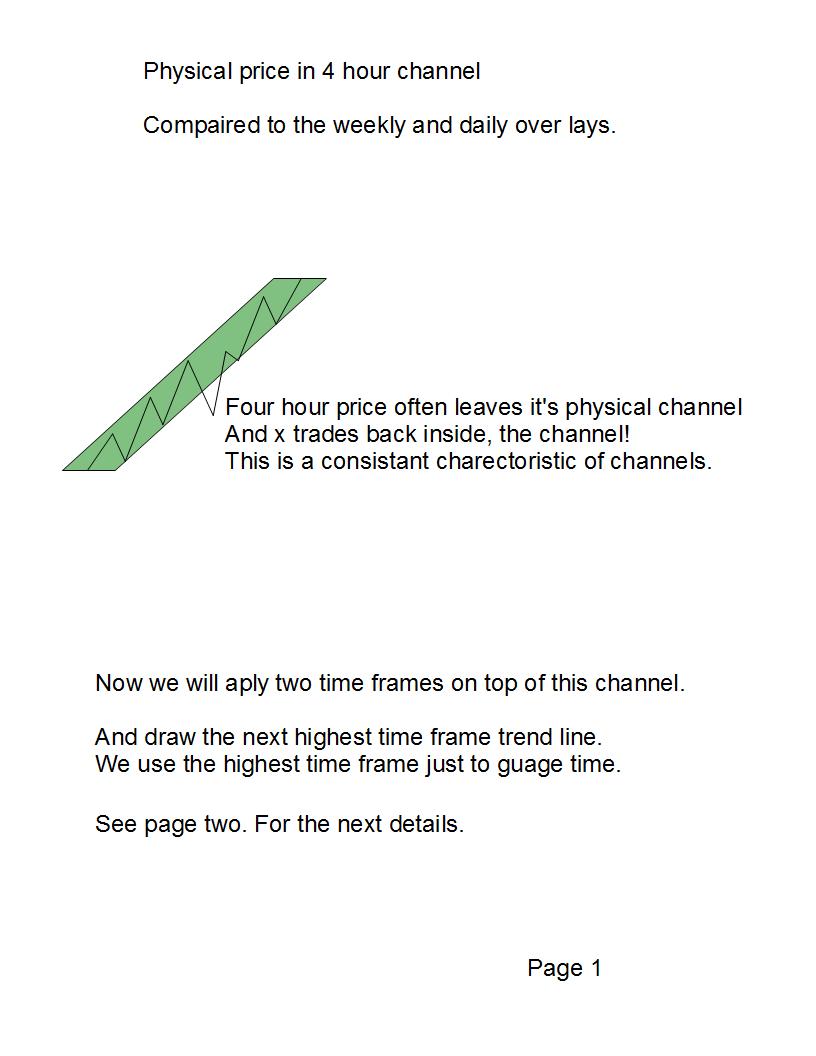
trend changer
i have to continue at this spot because i have gotten mailings from traders who really and genuinely want my help.
and this seems to be the easiest way right now. your right you did not ask me to come back, but you words
did convince me to give it one more shot.
so if we know
so if we know this is common on the four hour freq. then this is common on all frequencies.
and it is: so how do you get tipped off in an early warning type system that tells you when
this type of event is most likely to happen?
how you do this is with a comparison!!
a comparison of the current channel and the upper freq. trend lines. and combination of the use of advertised
closes, and often data transfer.
this comparison will tell you when the upper freq. is about to make a counter trend move on the larger freq.
what can this information do for you?
it can produce counter trend trades!
it keeps traders from entering the market with trend just as price is about to go against them.
and having a early warning a trader can develop an expectation of what price rejoining the trend could be.
lets take a look at the physical channel compared to the over lays time frame.
so starting tomorrow afternoon i will show traders how to compare a physical channel with an over lay trend line.
this is one concept that is very simple to understand. but there is a complex statement that has to be understood.
it is called compression and decompression of price.
compression is when you filter noise out of the system using an upper time frame. ( this can make the upper time frames
trend line steeper then the actual channel of physical price.)
decompression is when you look at physical price channels to get a perspective on the noise.
Cheat Sheets
i will show you how to apply to day trading.
but not right away. the one thing you can count on is: what i have been teaching you happens on all frequencies.
from the tick chart all the way up to the yearly charts. every thing is under the same design!
so we will get to the specifics of day trading anyways though. after we get a few things strait first. k
trend changer mailed me and changed my mind to come back.Looking forward to seeing this applied to day trading, this is where the guts of your system will be tested because as we all know or should know, every new trend and counter-trend begins from the tinniest time frame first, the tick and then explodes to the higher time frames.
Boe, are you any closer in providing us your cheat sheets?
Regards,
meek
yes i am still working on them
yes i have been working on the cheat sheets. but my time is very limited. so it will take a while.
ok channel
ok physical channel and over lays converge on the back side of both of there trend lines at the same time.
this signals a range and it signals a channel shift, for the physical price!!!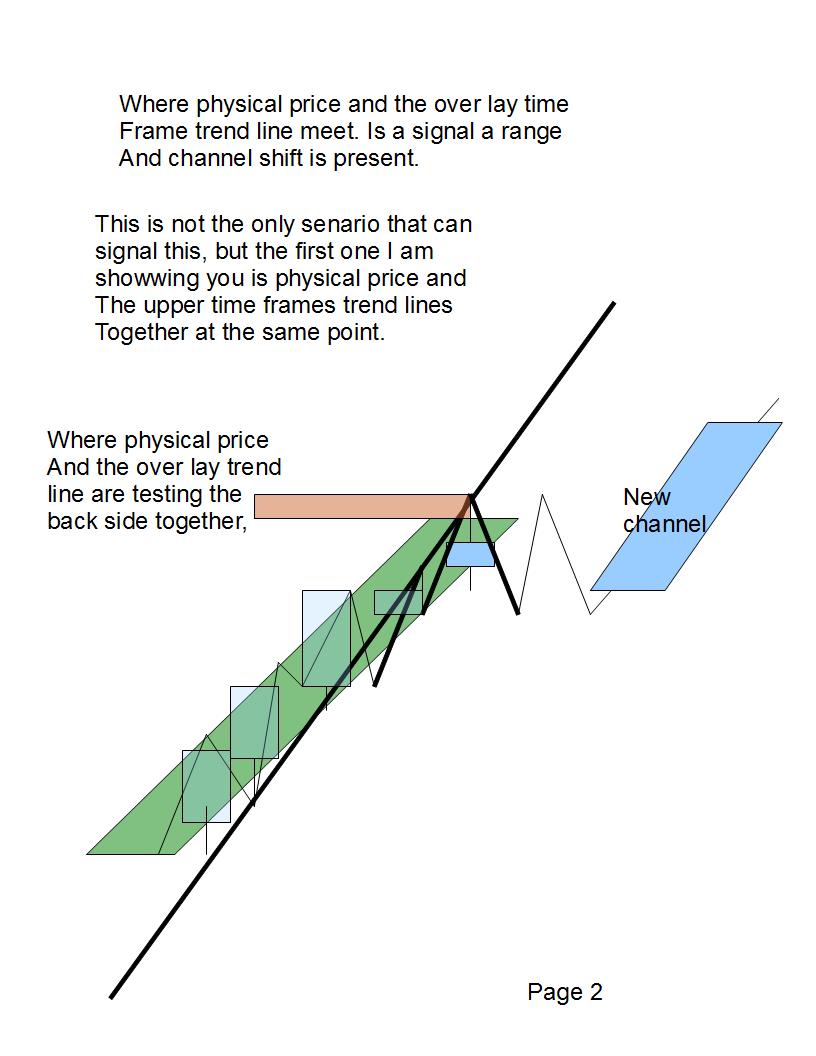
not only
not only can you use this technique for channel shifts, but also to look for reversal timing.
lets say : you know you are in a four hour range and you want to time a with trend entry off the four hour
swings.
so you lower your freq. to the 15 minute time frame and drop a one hour over lay on top.
here is live shot how you can use this to time a reversal.
now you get outside the channel with physical price but this is not enough.
the timing comes in with a data transfer off the upper time frame as price test the back side of the channel.
knowledge is power!
knowledge is power! so lets say to were tracking a four range! and you were treating the momentum swing
against the trend as it's own trend!
1. what do you expect from a trend? you expect x-trades! ( so you expect the channel momentum trade against
you to break the channel and for momentum to continue.)
2. then later you expect the channel to be broken again, and get a date transfer test on a higher freq.--four---or one---
3. four hour swings.. means the 4 hour is your monthly analysis.. and the one hour is your weekly analysis.
4. some times you may not see it! or have first time trust issues. sometimes its not perfect.
5. there is fail safe!!
6. the fail safe is: when physical price breaks the last remaining 4 hr trend line marking the momentum against you.
(breaking containment if you will) then there will be a physical test of this line after price breaks it.
i call them hidden quick test... why hidden? because the tests happen on the over lay trend line which no one is using. so its like a secret.
here is shot of a quick test..
quick tests and test of break outs
quick tests and retest of break outs hardly ever work with just physical price alone.. no matter what the analysis is!
in fact 90% of them are traps.
but (test of over lay trend lines) are 99% good if your analysis is in the right frame of mind.
so here is a shot of the same price lines with just the 15 minute time frame.
traders see the break but only see it as false break of there line, so if there in they get nervous and dump it.
but not us we know exactly where the test will be.
Start of trend line is subjective
Boe
I think drawing of new trend lines can be very subjective, especially when it can affect how to takes trades off it. This goes the same for channels. Do you think we should take the first two points of the higher time frame candles to initially draw our trend lines and channels?
Here I have attached a M5 with H1 & H4 overlays. Since I used the first two H4 overlay candles in change of trend we could have had some really good trades on the M5 charts trading from lower to upper channel.
This channel acted perfectly but if I used different points do draw the channel the results would be completely different. So aint this a bit subjective or have I missed the point completely?