Metatrader 5 versions of indicators ...
...
"Classical" averages with a twist :
Colors change depending on the angle of the slope : the greater the angle the color will be closer or equal to "Fast up" color. The smaller the angle the color will be closer or equal to "Fast down" color. The rest is drawn as a gradient between the two colors (depending on the angle of MA)
The "equal" part depends on the "Angle threshold for color steps" parameter : if you set 90, it is obvious that it will never be reached. Default for this parameter is set to 20 degrees
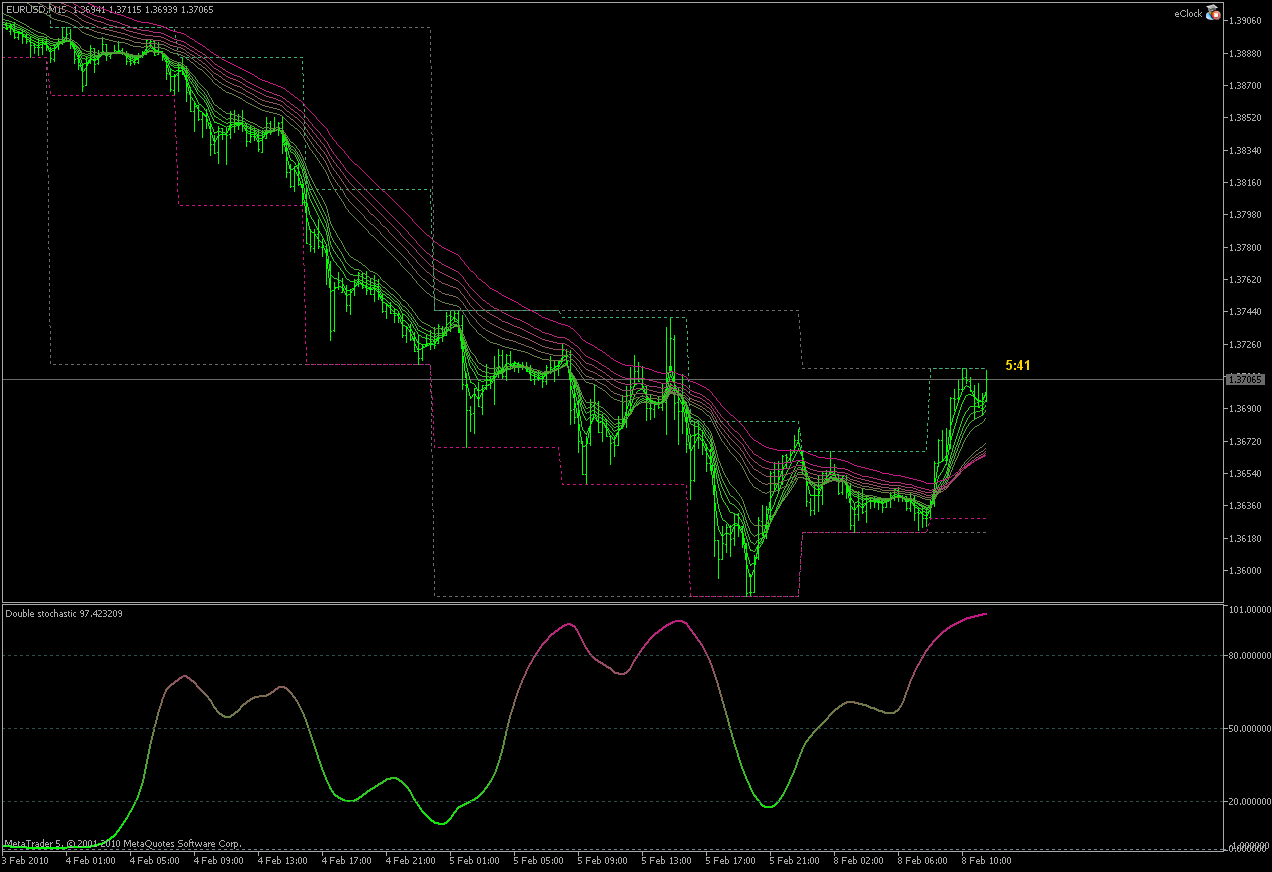
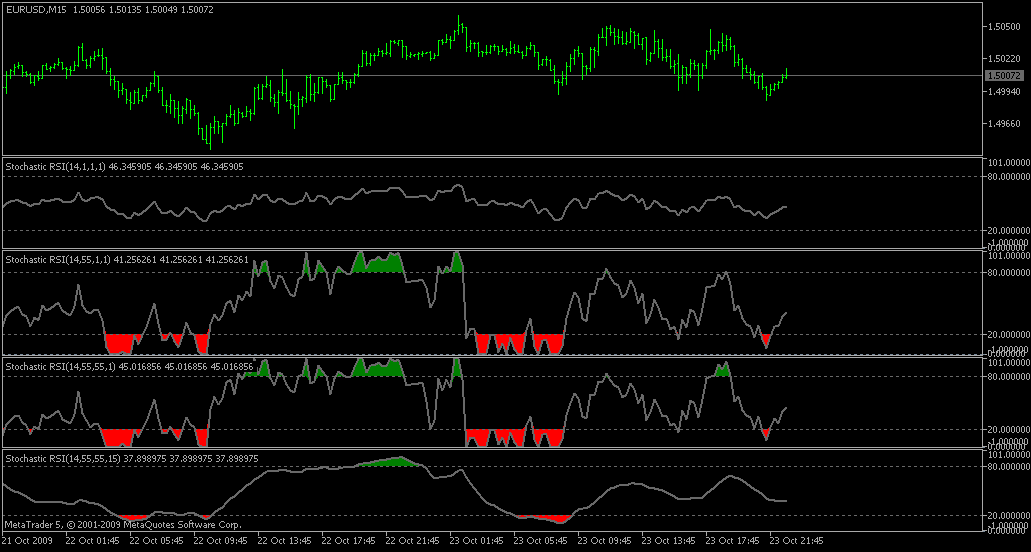
Stochastic RSI
Stochastic RSI :
_________________________
Depending on parameters (stochastic 1, stochastic 2 and smoothing) it is :(x,x,x) a simple RSI_________________________ PS:(x,x,n) a smoothed RSI
(n,x,x) or (x,n,x) stochastic RSI in its "classical" way
(n,x,n) or (x,n,n) smoothed stochastic RSI
(n,n,x) double stochastic RSI
(n,n,n) smoothed double stochastic RSI
x -> parameter is less than or equal to 1n -> parameter is greater than 1
...
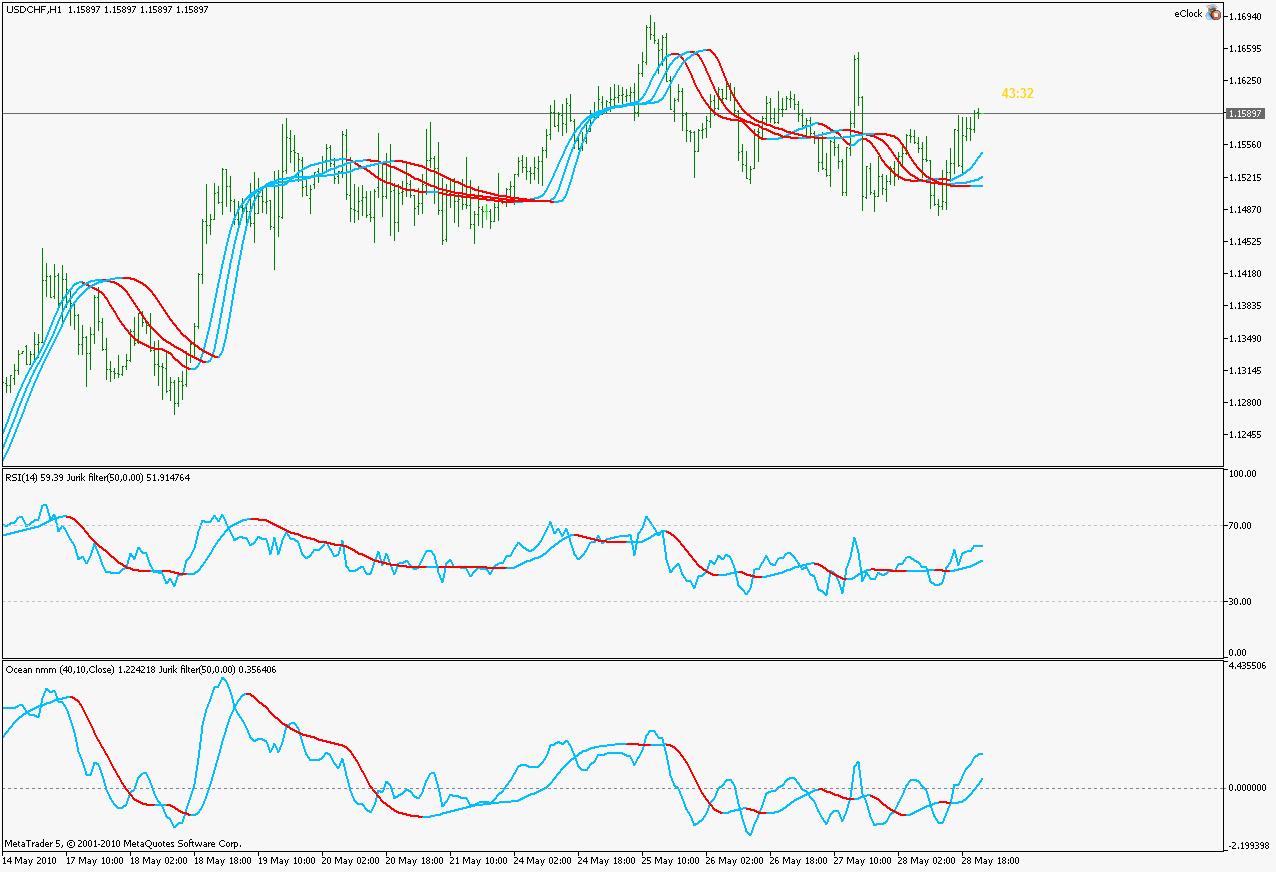
One more average (from this thread https://www.mql5.com/en/forum/179662) - metatrader 5 version (simbas combination of parameters on the picture  )
)
_______________________________

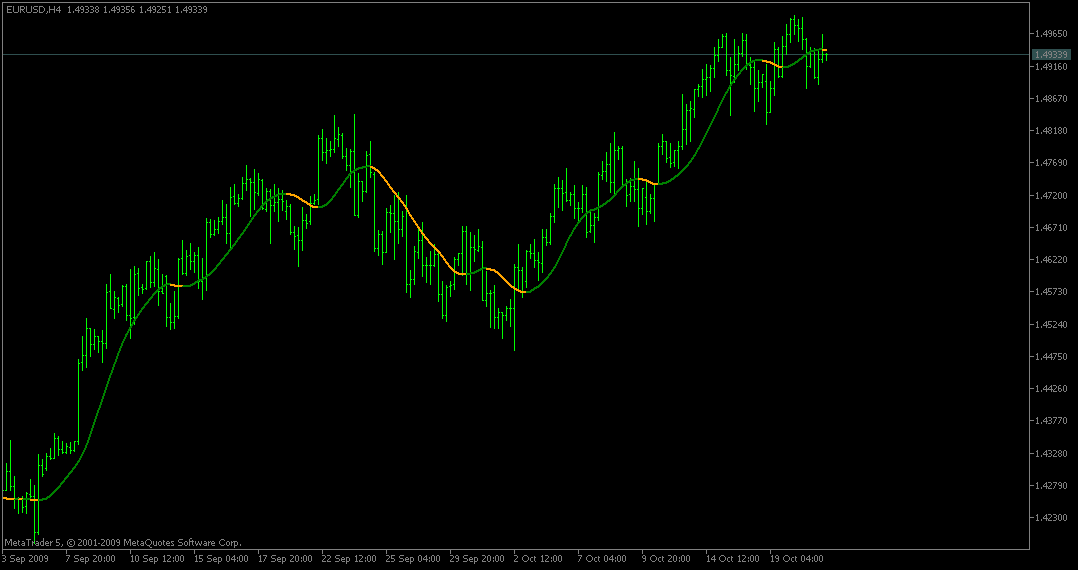


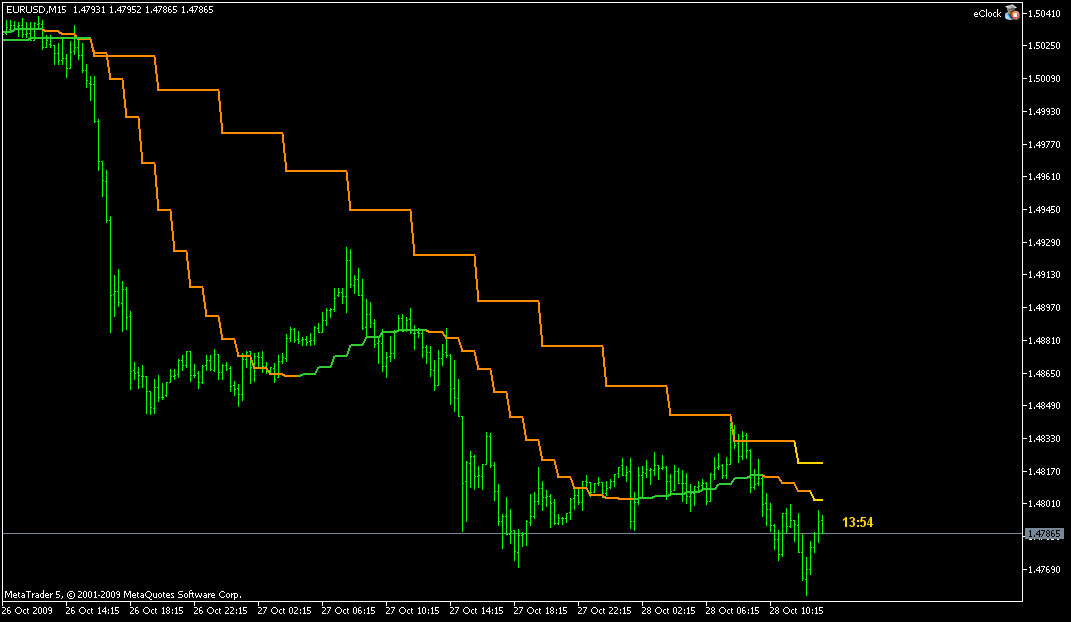
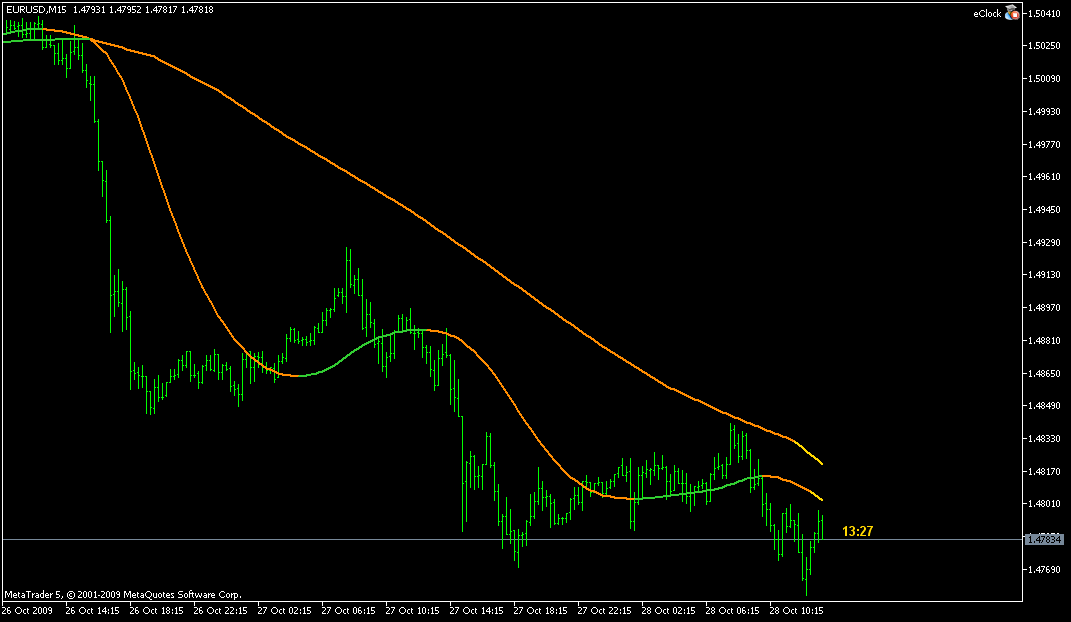
Added colors to show the slope of the average. To turn of the colors set the first two colors to same valueAdded multi time frame capabilities. Multi time frame can be drawn the "classical" (step like way - third picture) or interpolated (points between the end points smoothed through linear interpolation - fourth picture). In multi time frame mode two more colors are shown : they are marking the last (current) bar of the higher time frame which is a subject to changes (it will be changed until the chosen time frame bar is not closed)
- www.mql5.com
...
This one was originally developed on TSD by linuxser, so I decided to keep it's name (due to tremendous effort linuxser made to solve some problems of this indicator in metatrader 4).
Metatrader 4 version did lack buffers for this one to display all the necessary data, so the usual implementation was to make it 2 indicators. Since the limitation does not exist in version 5, it is a single indicator now. What is an addition is the timer (the timer attached is and EA, not an indicator). As far as I know woodies club is using indicator similar to this on a 5 minute chart strictly watching on the time left for the bar to complete. Since the timer attached really does show time every second (it even shows when the new bar is "late"), the two together are what one could call a "woodies system"
_____________________________________
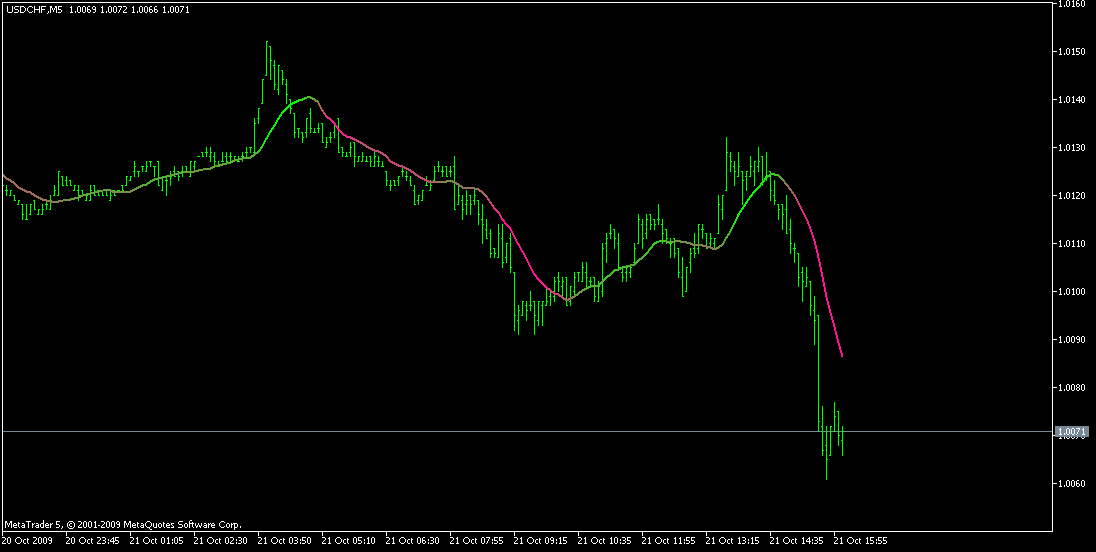
PS: of LSMA and EMA line colors : colors are shown as a relation of close to LSMA or EMA - if close is above -> the line is green, if close is bellow -> the line is red
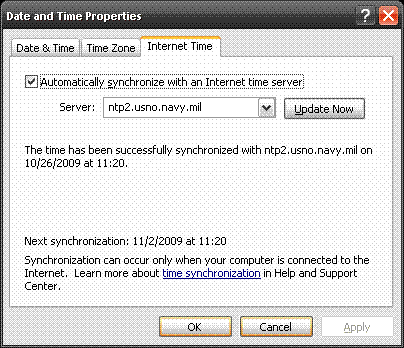
PPS: for the eClock to work properly, make sure that your computer time is synchronized. The easiest way is to do it through "adjust date time" in windows (something like on this picture) otherwise your local time and broker time may have difference in seconds.
Pivot points
Slowly preparing the rest of indicators normally found on metatrader 4
__________________________
Pivot points for metatrader 5
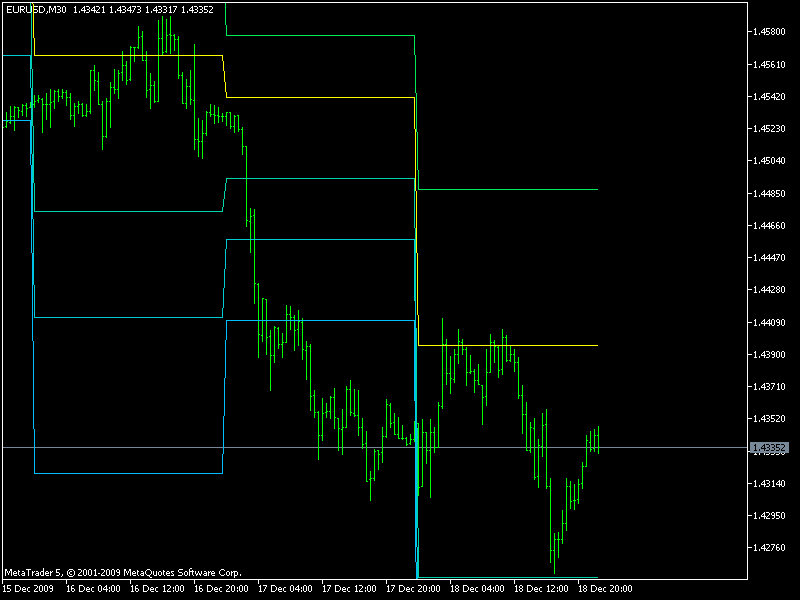
Since parameters are descriptive now (new feature of metatrader 5) just an explanation what does "Hide connecting lines between periods" do. This indicator is drawn as indicator buffers and not objects. hence when period changes, it will draw a "connecting line" between two periods like on this picture :
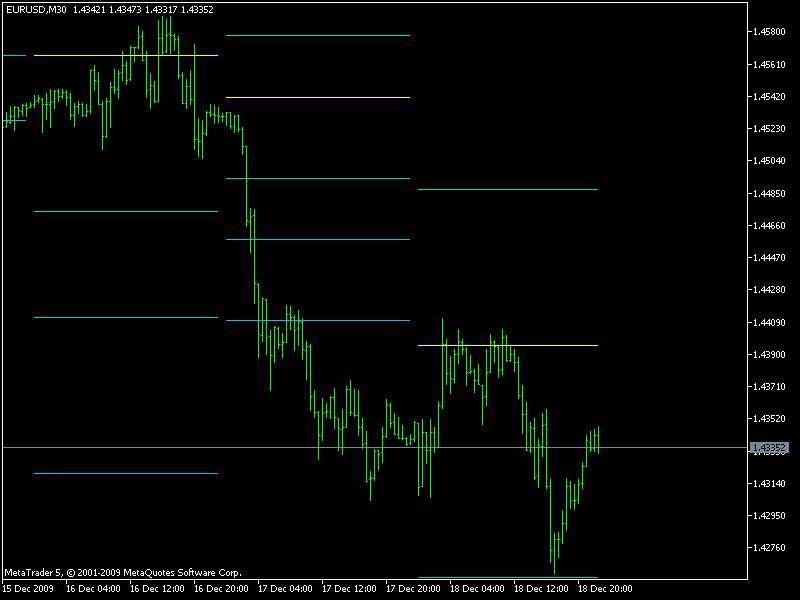
When "hiding" is turned on, it will show it like this picture, but the "cost of it is that one point is missing (it needs to make a break in data in order to hide those connecting lines)
Compared to metatrader 5 this one can show literally any period from 1 minute to 1 month (so any time frame recognized by metatrader 5 (the 8 hour is rather useful in my opinion))
Additions - added 4 ways of calculating pivot points :
(Previous High +Previous Low + Previous Close)/3Added "alternate way" of calculating pivot support and resistance lines - I found that in a lot of versions the R3 and S3 are calculated differently than the original (it effectively makes it "tighter" than the original) so I decided to enable that way too(Previous High +Previous Low + Previous Close + Previous Close)/4
(Previous High +Previous Low + Previous Close + Open)/4
(Previous High +Previous Low + Open + Open)/4
__________________________
PS: no yearly pivot in this one
...
This thread has been neglected a bit lately (it seems that the "speed" of invoking new metatrader is not what they planed it to be)
Here is a simple setup of a couple of indicators (mrtools excellent work reminded me of Guppy MMA). Also, the highs/lows, due to the fact that it covers all the time frames supported by metatrader 5, does not have equivalent in metatrader 4
PS: the simple.tpl should be copied to profiles/templates sub-folder of metatrader 5
- www.metatrader5.com
...
Adding this one to metatrader 5 collection too.
______________________________
The main reason for making it is experimenting with the "novelty" that metatrader 5 has - applying indicator to other indicator without changing code. So, on the picture those are all just one indicator but applied to previous indicator value (2 of the 3 on the main chart are applied to previous Jurik filter, for example)This is one of the good things in the new metatrader. Unfortunately some other things are not so good (for example for the last couple of months color histogram 2 does not work as it should, and they still did not notice it). Some other things that are far more serious are still not solved, so it seems that we have to wait some more. Till then we can test it and prepare ourselves slowly in case it becomes a usable trading platform
Daily Pivots
Hi Mladen
Pivot= ( yesterday_high + yesterday_low + yesterday_close ) / 3.0 ;
R1= ( 2.0 * Pivot ) - yesterday_low;
S1= ( 2.0 * Pivot ) - yesterday_high;
R2 = Pivot+ ( R1] - S1);
S2 = Pivot- ( R1] - S1] );
R3= ( 2.0 * Pivot) + ( yesterday_high - ( 2.0 * yesterday_low ) );
S3= ( 2.0 * Pivot) - ( ( 2.0 * yesterday_high ) - yesterday_low );
R0 (Mid)= ( Pivot + R1) / 2.0;
S0 (Mid)= ( Pivot + S1) / 2.0;
R1 (Mid)= ( R1 + R2) / 2.0;
S1(Mid) = ( S1 + S2 ) / 2.0;
R2(Mid) = ( R2 + R3 ) / 2.0;
S2(Mid) = ( S2 + S3 ) / 2.0;
Daily Pivots Formul
GMT Shift
MQ5 Version
Thanks
Apeiron
Moved your post here since you can see it and since the original indicator was posted here. Extended the pivot points indicator from a few post above )so the one that can draw pivot points for any time frame) to draw middle lines too (so this one has an option to turn on middle points to regardless of the calculation method). Will find some solution for GMT shift too
regards
Mladen
Hi Mladen
Pivot= ( yesterday_high + yesterday_low + yesterday_close ) / 3.0 ;
R1= ( 2.0 * Pivot ) - yesterday_low;
S1= ( 2.0 * Pivot ) - yesterday_high;
R2 = Pivot+ ( R1] - S1);
S2 = Pivot- ( R1] - S1] );
R3= ( 2.0 * Pivot) + ( yesterday_high - ( 2.0 * yesterday_low ) );
S3= ( 2.0 * Pivot) - ( ( 2.0 * yesterday_high ) - yesterday_low );
R0 (Mid)= ( Pivot + R1) / 2.0;
S0 (Mid)= ( Pivot + S1) / 2.0;
R1 (Mid)= ( R1 + R2) / 2.0;
S1(Mid) = ( S1 + S2 ) / 2.0;
R2(Mid) = ( R2 + R3 ) / 2.0;
S2(Mid) = ( S2 + S3 ) / 2.0;
Daily Pivots Formul
GMT Shift
MQ5 Version
ThanksHi mladen and happy new year ! 
i come back!
Could you please convert this indicator in mq5 format?
Best regards
Doc
- Free trading apps
- Over 8,000 signals for copying
- Economic news for exploring financial markets
You agree to website policy and terms of use
Some of you might remember this one : originally it was a part of an expensive system. Than it was coded as dots because of the repainting problems in metatrader. Here is a version for metatrader 5 : slightly changed the look of it (Bollinger bands is drawn as the "shadow" in the background)
Also you can see in the code how easy it is now to make it not repaint (and the new macd line is 4 color now, which could be possible in metatrader 4 if only the macd line was drawn, otherwise it is impossible to make it in metatrader 4 without repainting)
Attached are both versions : metatrader 4 (non repainting version) and metatrader 5 version