Connect The Cross Trading Strategy
pinbar.mq5 in https://www.mql5.com/en/code/1768

- votes: 20
- 2013.07.31
- Andrey Shpilev
- www.mql5.com
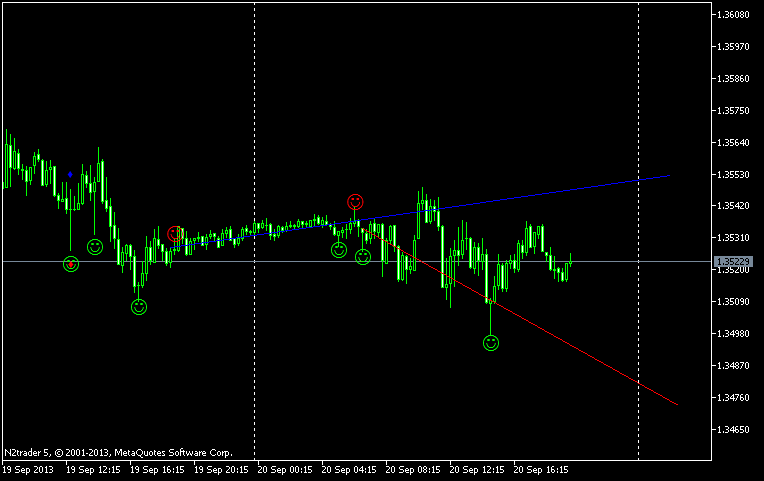
this is the easiest part ; drawing 2 line from the 4 point we have them. ( assume that's done )
and now what is the point from your strategy ?
Connect The Cross Trading Strategy
TIMisthebest, 2013.09.20 22:57
this is the easiest part ; drawing 2 line from the 4 point we have them. ( assume that's done )
and now what is the point from your strategy ?
for determination support and resistance , do you use any indicator in mql5 , which of them ?
some "Support and Resistance" indicators :
support_and_resistance.mq5 in https://www.mql5.com/en/code/401 ------> ** ?
pivot.mq5 in https://www.mql5.com/en/code/95
adaptiverenko.mq5 in https://www.mql5.com/en/code/1177
nrtr_rosh_v2.mq5 in https://www.mql5.com/en/code/428 ------> *** ?
nrtr.mq5 in https://www.mql5.com/en/code/145 ------> *** ?
supersr6.mq5 in https://www.mql5.com/en/code/1406
ma_rounding_channel.mq5 in https://www.mql5.com/en/code/1212 ------> ** ?
- votes: 10
- 2011.08.03
- Nikolay Kositsin
- www.mql5.com
nrtr_rosh_v2.mq5 :
Real author:
Description:
This indicator marks its values depending on the current trend.
In case of a downward trend, the indicator is colored red and magenta. In case of an upward trend, it is colored lime and aqua. When prices are rising, the level where crosses are set is a support line. When prices are falling they represent a resistance line. Similarly, aqua points show resistance levels when prices go up, while magenta ones show support levels during a downward trend.
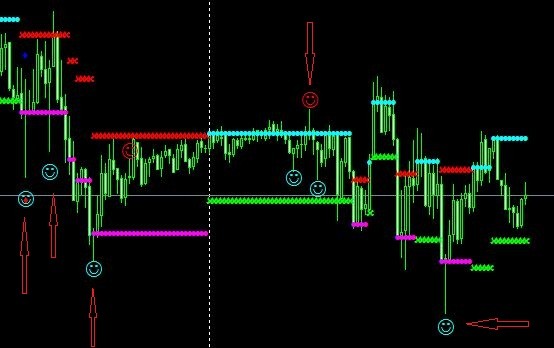
nrtr.mq5 :

can you please share your analysis about this
or any other idea can check it ?
Example: Each set of candles creates a picture, the 1M, all the way to the monthly charts, are creating a picture, so the idea is to connect the small pieces of the puzzle together with the whole. Then it is easier to determine what the big picture looks like. Knowing what the finished puzzle looks like, reveals the placement of the next piece, or (the next trade),. It will vary somewhat according to events effecting the dynamics of the market and resulting price action, but overall, it will be very similar to what the creation is. I am working on the expert for this analysis. It is unlike anything you have ever heard of probably, and would take much time to fully describe here. I expect the resulting product, to be the best performing Expert in the world. Amazing the entire world financial market. I am optimistic. Similar to the story of the Japanese rice trader who created the candlestick chart, and placed 100 profitable trades in a row, without a single loss, and became the most wealthy man of his time. According to the legend anyway. He was also known as a devout religious man, so full of optimism, I'm sure.
In my observation of the above, the price is trading in a range, and somewhat sideways pattern, and so there is not an established trend yet. Just looking at it, is what it looks like to me. The two lower crosses tells me it could be a double bottom, and the entire picture looks like something entirely different.. Could trade the support and resistance levels using any oscillator, but watch for the breakout. To code would need to calculate the candles and coordinate the oscillator and include trading models ect in the expert.
- www.mql5.com
I visualize now, working to code it for auto trading and/or signal. A detailed observation of where the market stops at each of the support and resistant levels on the above charts (or any chart for that matter) should reveal the pattern being created. The more careful the observational study, the better accuracy of the perception, which should result in more profitable trades, and the design of better performing Experts.
Example: Each set of candles creates a picture, the 1M, all the way to the monthly charts, are creating a picture, so the idea is to connect the small pieces of the puzzle together with the whole. Then it is easier to determine what the big picture looks like. Knowing what the finished puzzle looks like, reveals the placement of the next piece, or (the next trade),. It will vary somewhat according to events effecting the dynamics of the market and resulting price action, but overall, it will be very similar to what the creation is. I am working on the expert for this analysis. It is unlike anything you have ever heard of probably, and would take much time to fully describe here. I expect the resulting product, to be the best performing Expert in the world. Amazing the entire world financial market. I am optimistic. Similar to the story of the Japanese rice trader who created the candlestick chart, and placed 100 profitable trades in a row, without a single loss, and became the most wealthy man of his time. According to the legend anyway. He was also known as a devout religious man, so full of optimism, I'm sure.
In my observation of the above, the price is trading in a range, and somewhat sideways pattern, and so there is not an established trend yet. Just looking at it, is what it looks like to me. The two lower crosses tells me it could be a double bottom, and the entire picture looks like something entirely different.. Could trade the support and resistance levels using any oscillator, but watch for the breakout. To code would need to calculate the candles and coordinate the oscillator and include trading models ect in the expert.
ok,
!?
Good luck.
- Free trading apps
- Over 8,000 signals for copying
- Economic news for exploring financial markets
You agree to website policy and terms of use
Needs: mathematically calculate the doji candle(cross), find candles and connect lines creating price channel, buy at bottom, sell at top, and vise versa.
Question, How to know when it will move above or below the price channel? Maybe buy and sell candle to candle, but when to move to new time chart with new target, is the question.
Any ideas?
By: Ken McCormick Forex Trading Strategist