Press review - page 495


GOLD (XAU/USD): Bad news for gold when interest rates go up (based on the article)

Daily price is on secondary correction within the primary bullish trend on the chart: price was bounce from 1,263.79 resistance to below for the support level at 1,222.84 to be testing for the correctional trend to be continuing with 1,188/1,171 bearish daily reversal target.


  • "The price was largely impacted by Janet Yellen’s announcement on Friday that the Fed will likely be following through on the much anticipated March interest rate hikes. This would be bad news for gold as when interest rates go up, investors go to investments that show yields based on interest rates. The interest rate hikes could be announced as soon at the March 14-15 FOMC meeting and are expected to take hold very shortly thereafter, a pace faster than the Fed’s norm."

Gold News: Sharp Decline due to Expected Interest Rate Hikes
  • gold-prediction.com
In the latest gold news: As of March 6 at 2:46am EST, gold was trading at $1231.43 per ounce. This figure shows a 2.02% drop from approximately this time last week when gold was up trading at $1256.76 per ounce, due to uncertainty surrounding many of Trump’s economic policies. Treasury Secretary Steven Mnuchin announced on Thursday that...
 

EUR/USD Intra-Day Fundamentals: U.S. Factory Orders and range price movement 

2017-03-06 15:00 GMT | [USD - Factory Orders]

  • past data is 1.3%
  • forecast data is 1.1%
  • actual data is 1.1% according to the latest press release

if actual > forecast (or previous one) = good for currency (for USD in our case)

[USD - Factory Orders] = Change in the total value of new purchase orders placed with manufacturers.

==========

From rttnews article:

  • "The Commerce Department said factory orders climbed by 1.2 percent in January after jumping by 1.3 percent in December. The increase in orders matched economist estimates."
  • "The report said orders for non-durable goods also rose by 0.4 percent in January after spiking by 3.4 percent in the previous month."

==========

EUR/USD M5: range price movement by U.S. Factory Orders news event


AUD/USD Intra-Day Fundamentals: RBA Cash Rate and 41 pips range price movement 

2017-03-07 03:30 GMT | [AUD - Cash Rate]

  • past data is 1.50%
  • forecast data is 1.50%
  • actual data is 1.50% according to the latest press release

if actual > forecast (or previous one) = good for currency (for AUD in our case)

[AUD - Cash Rate] = Interest rate charged on overnight loans between financial intermediaries.

==========

From news.com.au article:

  • "THE Reserve Bank has left the official cash rate on hold at 1.5 per cent for the sixth meeting in a row."
  • "Laing+Simmons managing director Leanne Pilkington said that with interest rates likely to be at their lowest point in the cycle, the time was ripe to help young Australians break into the market, called on the NSW Government to follow Victoria’s lead by abolishing stamp duty for first home buyers."

==========

AUD/USD M5: 41 pips range price movement by RBA Cash Rate news event

Cash Rate | RBA
  • www.rba.gov.au
Interest Rate Decisions Effective Date Change in cash rate New cash rate target 8 Mar 2017 8 Feb 2017 7 Dec 2016 2 Nov 2016 5 Oct 2016 7 Sep 2016 3 Aug 2016 6 Jul 2016 8 Jun 2016 4 May 2016 6 Apr 2016 2 Mar 2016 3 Feb 2016 2 Dec 2015 4 Nov 2015 7 Oct 2015 2 Sep 2015 5 Aug 2015 8 Jul...
 

Brent Crude Oil - ready to go (adapted from the article)

Daily price is located near and above Senkou Span line which is the virtual border between the primary bearish and the primary bullish trend on the chart. The price is moving along the upper border of Ichimoku cloud to be ready for bearish reversal or to the bullish trend to be resumed.

s

  • "Crude oil prices continue to trade off of yearly highs, but have failed to breakout significantly for the 2017 trading year. As such, traders continue to wait for a market catalyst to cause the commodity to breach key values of either support or resistance. Key news for this week includes the release of US employment data this Friday. Expectations for US NFP (Feb) is set at +190k, while the US Unemployment Rate is set to be released at 4.7%."
  • "Technically the price of crude oil remains in an ongoing daily trading range, which is depicted below. Current daily resistance remains located at the January 3rd 2017 peak at $55.67. Alternatively, crude oil prices remain supported above the January 10th low at $51.34. As prices continue to ping between these values, traders may continue to reference these points for a potential market breakout."

Crude Oil Prices Poised For A Breakout
  • DailyFX
  • www.dailyfx.com
Crude oil prices continue to trade off of yearly highs, but have failed to breakout significantly for the 2017 trading year. As such, traders continue to wait for a market catalyst to cause the commodity to breach key values of either support or resistance. Key news for this week includes the release of US employment data this Friday...
 

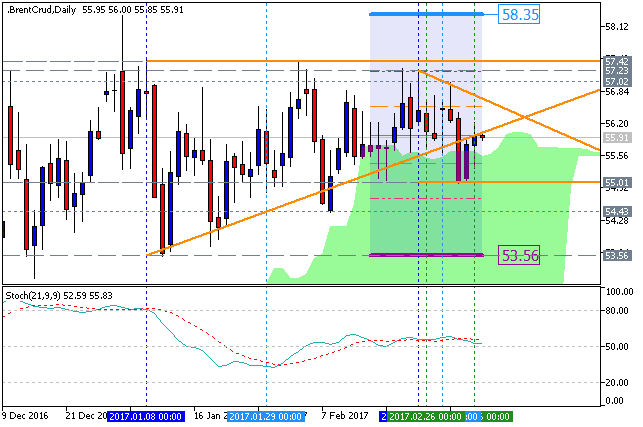
EUR/USD Intra-Day Fundamentals: German Factory Orders and range price movement 

2017-03-07 07:00 GMT | [EUR - German Factory Orders]

  • past data is 5.2%
  • forecast data is -2.5%
  • actual data is -7.4% according to the latest press release

if actual > forecast (or previous one) = good for currency (for EUR in our case)

[EUR - German Factory Orders] = Change in the total value of new purchase orders placed with manufacturers.

==========

From official report:

  • "Based on provisional data, the Federal Statistical Office (Destatis) reports that price-adjusted new orders in manufacturing had decreased in January 2017 a seasonally and working-day adjusted 7.4% on December 2016. For December 2016, they increased by 5.2% compared with November 2016, thus confirming the provisional result published in the previous month. Price-adjusted new orders without major orders in manufacturing had decreased in January 2017 a seasonally and working-day adjusted 2.9% on December 2016."
  • "In January 2017, domestic orders decreased by 10.5% and foreign orders by 4.9% on the previous month. New orders from the euro area were down 7.8% on the previous month, new orders from other countries decreased 2.9% compared to December 2016."

==========

EUR/USD M5: range price movement by German Factory Orders news event


USD/CNH Intra-Day Fundamentals: China CGAC Trade Balance and 99 pips range price movement 

2017-03-08 03:35 GMT | [CNY - Trade Balance]

  • past data is 355B
  • forecast data is 173B
  • actual data is -60B according to the latest press release

if actual > forecast (or previous one) = good for currency (for CNY in our case)

[CNY - Trade Balance] = Difference in value between imported and exported goods during the previous month.

==========

From theaustralian article:

  • "China’s trade balance for February has fallen short of expectations with a deficit of -60.4 yuan vs. 172.5bn surplus expected."
  • "Imports and exports both deviated from forecasts causing the swing, with import growth rising to 44.7 per cent vs. 23.1 per cent expected, while export growth fell to 4.2 per cent vs. 14.6 per cent expected, according to Bloomberg."
  • "The Australian dollar fell from US76.07 cents to US75.95 cents on the announcement, quickly stabilising with last read at US76.01 cents."

==========

USD/CNH M5: 99 pips range price movement by China Trade Balance news event


Dollar Index: daily bullish reversal (based on the article)

Daily price broke Ichimoku cloud for the bullish reversal: the price is on testing 102.26 resistance level for the bullish trend to be continuing, otherwise - ranging.


  • "DXY continues to trade on parallels that are defined by the 2016 support line (from the May low). The yearly opening price is 102.38 and could influence for a reaction. I’d also pay attention to 100.39 (March 2015 high…here we are 2 years later by the way at the same level!) for support. A break through one of these levels ideally offers something to work with from a trend perspective."


NZD/USD Technical Outlook: breakdown with the bearish reversal (based on the article)

Daily price is on breakdown to be started in 1st of March this year: price broke Ichimoku cloud to below to be reversed from the bullish to the primary bearish market condition with 0.6947/0.6933 resistance levelss to be testing for the bearish trend to be continuing.


  • "The plunge in NZDUSD has seen it all the way back down to an important trend-line rising up from August 2015, where it spiked down to just under 6200. Also in the vicinity is horizontal support running back to June. The two angles of support are creating confluence, which makes the area in the mid-6900s very important. "
  • "How NZDUSD responds here will be telling. It is currently trading below support, but that could change by day's end; putting in a reversal day. So we'll wait until the end of the New York session before drawing any concrete conclusions. Kiwi is known for sharp reversals after extended moves, and so it shouldn’t take long to turn higher, if it is to do so. With that in mind, should we see a bounce, but with little pep in its step over the next few days then it may not be long after before it attempts to break support and seek out those beforementioned levels. On the top-side, the first notable level of resistance we will look to on a rally is the trend-line running off the 2/7 high."

NZDUSD Technical Outlook: Big Trend-line Test Under Way
  • DailyFX
  • www.dailyfx.com
The plunge in NZDUSD has seen it all the way back down to an important trend-line rising up from August 2015, where it spiked down to just under 6200. Also in the vicinity is horizontal support running back to June. The two angles of support are creating confluence, which makes the area in the mid-6900s very important. A turn higher here is...
 

USD/CNH Intra-Day Fundamentals: China Consumer Price Index and 113 pips range price movement 

2017-03-09 01:30 GMT | [CNY - CPI]

  • past data is 2.5%
  • forecast data is 1.9%
  • actual data is 0.8% according to the latest press release

if actual > forecast (or previous one) = good for currency (for CNY in our case)

[CNY - CPI] = Change in the price of goods and services purchased by consumers.

==========

From btvi article:

  • "China's consumer price index (CPI) grew 0.8 per cent in February from 2016, according to figures released Thursday by the National Bureau of Statistics."
  • "This was in comparison to a 2.5 per cent year-on-year increase registered in January, Efe news reported."
  • "China also announced that the producer price index (PPI), which measures the variation of wholesale prices, reached its highest level since 2008, growing by 7.8 per cent year-on-year in February."

==========

USD/CNH M5: 113 pips range price movement by China Consumer Price Index news event


GOLD (XAU/USD) - ranging correction with descending triangle pattern to be formed with 1,206 support level (based on the article)

Daily price is located above Ichimoku cloud and below 200-day SMA in the bullish area of the chart with the secondary ranging condition.

If the price breaks 200-day SMA value at 1,263.79 to above so the primary bullish trend will be resumed.
If daily price breaks 1,206.59 support level to below so the bearish reversal may be started.
If not so the price will be on ranging waiting for the direction of the trend.


  • "Gold prices have gotten crushed; moving from a swing-high above $1,250 just a week ago to below $1,210 as of this writing to tally a total move of -3.3% in a single week. To be sure, there is prime motivation for such a theme which is likely why we’ve seen such little respect of support as Gold prices have been on the way down. With a key Fed meeting next week in which the world may get just the 3rd rate hike from the bank in the past 10 years, the table is set for a continuation of USD-strength and few traders have wanted to stand in the way of the move-lower in Gold prices."
  • "So there is legitimate continuation potential here for further bearish momentum. For traders looking to gain such exposure, resistance at the $1,215.17 area could be extremely attractive for such a scenario. This is the 38.2% Fibonacci retracement of the 2013-2015 major move in Gold prices, but perhaps more importantly this level has come as pertinent to price action over the past few months."

Gold Prices Slide Down the Slope of Despair
  • DailyFX
  • www.dailyfx.com
, we asked if bulls in the Gold market were in the early process of retreat. At the time, rate hike expectations for the United States were steadily increasing for the upcoming March meeting, taking place next Wednesday. Previously, it didn’t’ appear as though Gold prices were buying the Fed’s rate hike plans. But as various just hours before...
Reason: