[USD - Crude Oil Inventories] = Change in the number of barrels of crude oil held in inventory by commercial firms during the past week.
==========
"U.S.
commercial crude oil inventories (excluding those in the Strategic
Petroleum Reserve) increased by 13.8 million barrels from the previous
week."
==========
Crude Oil M5: ranging to bullish reversal. The price was bounced from 54.47 support level to above crossing 200 SMA level for the bullish reversal with 55.56/55.66 resistance level.
If the price breaks 55.56 resistance level to above on M5 close bar so the bullish trend will be resumed with 55.66 target to re-enter. If the price breaks 54.47 support so the bearish trend will be resumed. If not so the price will be on ranging within the levels.
==========
Crude Oil Daily: bullish ranging within last monthly bar.
The price is above 100 SMA/200 SMA in the bullish area of the charts:
57.42/58.35 resistance levels are the key ones for the bullish trend to be resumed.
If daily price breaks 57.42 resistance on close daily bar so the primary bullish trend will be resumed with 58.35 nearest bullish target. If the price breaks 50.63 support level to below so the bearish reversal of the daily price movement will be started. If not so the price will be on bullish ranging within the levels.
Coca-Cola Co (NYSE: KO) - new options become available today, for the June 2018 expiration(based on the article)
Daily shares price is locaed above Ichimoku cloud in the bullish area of the chart. Chinkou Span line is above Ichimoku cloud indicating the bullish breakout by direction with the good confirmation of Absolute Strength and Trend Strength indicator: the price is crossing ascending triangle pattern to above at 41.97 resistance level for the bullish breakout to be continuing with 42.24 nearest target to re-enter.
"Investors in Coca-Cola Co (NYSE: KO) saw new options become available today, for the June 2018 expiration. One of the key data points that goes into the price an option buyer is willing to pay, is the time value, so with 492 days until expiration the newly available contracts represent a possible opportunity for sellers of puts or calls to achieve a higher premium than would be available for the contracts with a closer expiration."
"Turning to the calls side of the option chain, the call contract at the $45.00 strike price has a current bid of 93 cents. If an investor was to purchase shares of KO stock at the current price level of $42.03/share, and then sell-to-open that call contract as a "covered call," they are committing to sell the stock at $45.00. Considering the call seller will also collect the premium, that would drive a total return (excluding dividends, if any) of 9.28% if the stock gets called away at the June 2018 expiration (before broker commissions). Of course, a lot of upside could potentially be left on the table if KO shares really soar, which is why looking at the trailing twelve month trading history for Coca-Cola Co , as well as studying the business fundamentals becomes important."
"Considering the fact that the $45.00 strike represents an approximate 7% premium to the current trading price of the stock (in other words it is out-of-the-money by that percentage), there is also the possibility that the covered call contract would expire worthless, in which case the investor would keep both their shares of stock and the premium collected. The current analytical data (including greeks and implied greeks) suggest the current odds of that happening are 68%."
if actual > forecast (or previous one) = good for currency (for NZD in our case)
NZD - Official Cash Rate] = Interest rate at which banks lend balances held at the RBNZ to other banks overnight.
==========
From official report: Official Cash Rate unchanged at 1.75 percent
"The Reserve Bank today left the Official Cash Rate (OCR) unchanged at 1.75 percent."
"New Zealand’s financial conditions have firmed with long-term interest
rates rising and continued upward pressure on the New Zealand dollar
exchange rate. The exchange rate remains higher than is sustainable
for balanced growth and, together with low global inflation, continues
to generate negative inflation in the tradables sector. A decline in
the exchange rate is needed."
==========
NZD/USD M5: 98 pips range price movement by RBNZ Official Cash Rate news event
Statement by Reserve Bank Governor Graeme Wheeler: The Reserve Bank today left the Official Cash Rate (OCR) unchanged at 1.75 percent. The recovery in commodity prices and more positive business and consumer sentiment in advanced economies have improved the global outlook. However, major challenges remain with on-going surplus capacity in the...
"The US economic calendar is stacked with many events throughout the month but none is more anticipated that the release of Non-Farm Payroll figures. Non-Farm Payrolls also known as NFP, is reported monthly by the US Bureau of Labor Statistics to give a timely glimpse into employment changes inside of the United States."
"Ultimately this report can give traders insight into whether the US economy is expanding or contracting while directly influences the decisions of policy makers such as the US Federal Reserve. With this in mind let’s take a closer at this news event, so we can better understand NFP and its potential impact on marks."
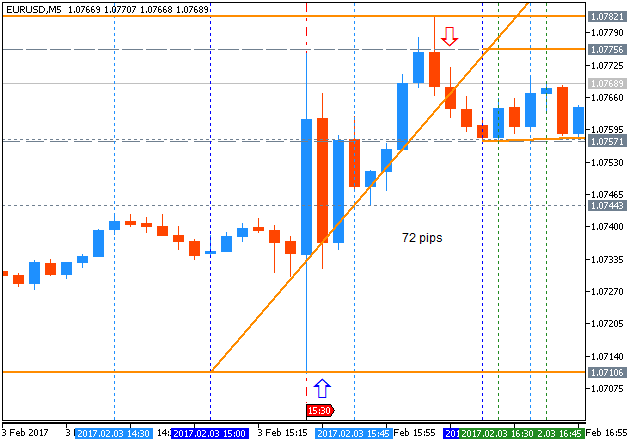
"Traditionally there are many ways of trading the news including breakouts , news fades, and trading market dips. Trading NFP can be an exciting and often profitable pursuit for traders willing to enter into a volatile market. Regardless of the strategy taken, it is always important to keep an eye on risk / reward levels while minimizing the use of leverage in case the event volatility moves the market against your trade. With this in mind, traders should expect increased volatility and plan their strategy for the day accordingly."
is stacked with many events throughout the month but none is more anticipated that the release of Non-Farm Payroll figures. Non-Farm Payrolls also known as NFP, is reported monthly by the US Bureau of Labor Statistics to give a timely glimpse into employment changes inside of the United States. Ultimately this report can give traders insight...
"I would like now to turn to the near-term outlook for the Australian economy. The Reserve Bank
will be releasing updated detailed forecasts tomorrow in our quarterly Statement on
Monetary Policy. or 2017 and 2018, these forecasts will show little change from our earlier forecasts. Over the
next couple of years we expect GDP growth to be around the 3 per cent mark. In both
years it will be boosted by a significant pick-up in LNG production. And the headwinds that we
have been experiencing from the unwinding of the biggest mining investment boom in a century
will blow themselves out. Indeed, we are already around 90 per cent of the way through
the fall from the peak to expected trough in mining investment. Another headwind we have had
over recent years – that is the decline in our terms of trade – has already stopped.
Since earlier last year, a rise in global commodity prices has provided a boost to our national
income. And the improvement in the global economy since late last year should also help us."
"Inflation remains low, running at around 1½ per cent in both headline and
underlying terms. Importantly, inflation is not expected to fall further. Instead, our central
forecast is for underlying inflation to gradually rise over the next couple of years, and for
headline inflation to increase a bit more quickly, boosted by increases in oil and tobacco
prices."
"In summary then, the Bank's central scenario is for some pick-up in economic growth and for
inflation to move gradually higher. As always, though, there are risks around that outlook. As
our record demonstrates, our economy does have a degree of resilience and flexibility that has
allowed us to maintain stability during a pretty difficult time in the global economy. There is
no reason that this can't continue. But we do need to continue to build that resilience,
while we take advantage of the considerable advantages that we have as a nation."
==========
AUD/USD M5: 36 pips range price movement by RBA Gov Lowe Speech news event
Senior officers of the Reserve Bank give speeches and participate in panel discussions on a broad range of topics related to its role and functions. These are part of the Bank's efforts to promote understanding of its decision-making and facilitate...
Nvidia shares continues flying high(based on the article)
Shares is on bullish market condition located above Ichimoku cloud: the price is testing 118/120 resistance levels for the bullish trend to be continuing.
"A little over a year and a half ago, shares of Nvidia were trading at below $20 per share and the company was barely getting much attention, neither on Wall Street or on Main Street. Fast forward to the present and Nvidia is one of the hottest companies around. Since trading at below $20 per share for most part of first half of 2015, shares have exploded higher and are currently trading at just under $120 per share, an impressive return of 600% in slightly over a year and a half."
"Nvidia will report earnings after the close of regular market trading Thursday night, and Street consensus is for the company to earn $0.83 per share on revenues of $2.1 billion for its quarter ended January 31, 2017."
if actual > forecast (or previous one) = good for currency (for CNY in our case)
[CNY - Trade Balance] = Difference in value between imported and exported goods during the previous month.
==========
From whylose article: China Trade balance, exports & imports beat expectations in CNY terms
"China’s trade balance for January, in Yuan terms, came in at 354.5
billion CNY vs 307.25 expected and 275.40bn last. Exports came at 15.9%
y/y vs 5.2%"
==========
USD/CNH M5: 56 pips range price movement by CGAC Trade Balance news event
Dollar Index - waiting for the direction of the trend to be started(based on the article)
Daily price is located inside Ichimoku cloud for the ranging market condition waiting for the direction of the trend to be started.
If the price breaks 61.8 resistance to above on close daily bar so the primary bullish trend will be resumed. If the daily price breaks 99.56 support level to below on close bar so the bearish reversal will be started. If not so the price will be on ranging within the levels waiting for direction.
"The three keys components that provided support were the Ichimoku Cloud base on the Daily Chart, which is comprised of the 50% retracement over the last 52 data periods. While price did break below the cloud technically, we did not see the lagging line (bright green) break into the cloud, and we did not see a strong move lower once price pierced the cloud, but rather price moved sideways before beginning this week’s retracement."
"An eventual break below last week’s low of 99.23, followed by a lagging line move into and through the Ichimoku Cloud would be the clearest Ichimoku sign of a larger breakdown developing in DXY."
"A zone of resistance to watch on the bounce would also be the 38.2-61.8% retracement region of the 2017 move, which is housed at 100.99-102.07. The wost case for Bulls (best case for Bears) would be a move to this zone that pivots and breaks above the zone above. A break above the Fibonacci zone could be indicative that we've seen the low in the USD for a while."
the chart above, you’ll notice three key zones of support that roughly held, which prevented the DXY from continuing its downtrend, at least for now. The three keys components that provided support were the Ichimoku Cloud base on the Daily Chart, which of the 50% retracement over the last 52 data periods. While price did break below the cloud...
if actual > forecast (or previous one) = good for currency (for GBP in our case)
[GBP - Manufacturing Production] = Change in the total inflation-adjusted value of output produced by manufacturers.
==========
From official report:
"The monthly estimate of total production increased by 1.1%. There were
mixed performances across the 4 production sectors; manufacturing
provided all the growth, increasing by 2.1%."
"The 3 months-on-previous 3 months estimate of total production increased
by 0.3% in December 2016, with increases in 3 of the 4 main sectors.
The largest contribution came from manufacturing, with growth of 1.2%."
==========
GBP/USD M5: 30 pips range price movement by U.K. Factory production news event
if actual > forecast (or previous one) = good for currency (for CAD in our case)
[CAD - Employment Change] = Change in the number of employed people during the previous month.
==========
From official report:
"CEmployment rose by 48,000 (+0.3%) in January, building on gains observed
in the latter part of 2016. The unemployment rate fell
by 0.1 percentage points to 6.8%."
"On a year-over-year basis, employment rose by 276,000 (+1.5%), with most of the increase occurring from August to January."
==========
USD/CAD M5: 64 pips range price movement by Canada's Employment Change news event
U.S. Commercial Crude Oil Inventories news event: intra-day ranging to the bullish reversal, daily bullish ranging within narrow s/r levels
2017-02-08 15:30 GMT | [USD - Crude Oil Inventories]
[USD - Crude Oil Inventories] = Change in the number of barrels of crude oil held in inventory by commercial firms during the past week.
==========
"U.S. commercial crude oil inventories (excluding those in the Strategic Petroleum Reserve) increased by 13.8 million barrels from the previous week."
==========
Crude Oil M5: ranging to bullish reversal. The price was bounced from 54.47 support level to above crossing 200 SMA level for the bullish reversal with 55.56/55.66 resistance level.If the price breaks 55.56 resistance level to above on M5 close bar so the bullish trend will be resumed with 55.66 target to re-enter.
If the price breaks 54.47 support so the bearish trend will be resumed.
If not so the price will be on ranging within the levels.
==========
Crude Oil Daily: bullish ranging within last monthly bar. The price is above 100 SMA/200 SMA in the bullish area of the charts: 57.42/58.35 resistance levels are the key ones for the bullish trend to be resumed.
If daily price breaks 57.42 resistance on close daily bar so the primary bullish trend will be resumed with 58.35 nearest bullish target.
If the price breaks 50.63 support level to below so the bearish reversal of the daily price movement will be started.
If not so the price will be on bullish ranging within the levels.
Coca-Cola Co (NYSE: KO) - new options become available today, for the June 2018 expiration (based on the article)
Daily shares price is locaed above Ichimoku cloud in the bullish area of the chart. Chinkou Span line is above Ichimoku cloud indicating the bullish breakout by direction with the good confirmation of Absolute Strength and Trend Strength indicator: the price is crossing ascending triangle pattern to above at 41.97 resistance level for the bullish breakout to be continuing with 42.24 nearest target to re-enter.
NZD/USD Intra-Day Fundamentals: RBNZ Official Cash Rate and 98 pips range price movement
2017-02-08 20:00 GMT | [NZD - Official Cash Rate]
if actual > forecast (or previous one) = good for currency (for NZD in our case)
NZD - Official Cash Rate] = Interest rate at which banks lend balances held at the RBNZ to other banks overnight.
==========
From official report: Official Cash Rate unchanged at 1.75 percent
==========
NZD/USD M5: 98 pips range price movement by RBNZ Official Cash Rate news event
What is NFP (based on the article)
"The US economic calendar is stacked with many events throughout the month but none is more anticipated that the release of Non-Farm Payroll figures. Non-Farm Payrolls also known as NFP, is reported monthly by the US Bureau of Labor Statistics to give a timely glimpse into employment changes inside of the United States."
"Ultimately this report can give traders insight into whether the US economy is expanding or contracting while directly influences the decisions of policy makers such as the US Federal Reserve. With this in mind let’s take a closer at this news event, so we can better understand NFP and its potential impact on marks."

"Traditionally there are many ways of trading the news including breakouts , news fades, and trading market dips. Trading NFP can be an exciting and often profitable pursuit for traders willing to enter into a volatile market. Regardless of the strategy taken, it is always important to keep an eye on risk / reward levels while minimizing the use of leverage in case the event volatility moves the market against your trade. With this in mind, traders should expect increased volatility and plan their strategy for the day accordingly."AUD/USD Intra-Day Fundamentals: RBA Gov Lowe Speech and 36 pips range price movement
2017-02-09 09:00 GMT | [AUD - RBA Gov Lowe Speaks]
[AUD - RBA Gov Lowe Speaks] = Speech at the A50 Australian Economic Forum Dinner, in Sydney.
==========
From official report:
==========
AUD/USD M5: 36 pips range price movement by RBA Gov Lowe Speech news event
Nvidia shares continues flying high (based on the article)
Shares is on bullish market condition located above Ichimoku cloud: the price is testing 118/120 resistance levels for the bullish trend to be continuing.
USD/CNH Intra-Day Fundamentals: China Trade Balance and 56 pips range price movement
2017-02-10 02:57 GMT | [CNY - Trade Balance]
if actual > forecast (or previous one) = good for currency (for CNY in our case)
[CNY - Trade Balance] = Difference in value between imported and exported goods during the previous month.
==========
From whylose article: China Trade balance, exports & imports beat expectations in CNY terms
==========
USD/CNH M5: 56 pips range price movement by CGAC Trade Balance news event
Dollar Index - waiting for the direction of the trend to be started (based on the article)
Daily price is located inside Ichimoku cloud for the ranging market condition waiting for the direction of the trend to be started.
If the price breaks 61.8 resistance to above on close daily bar so the primary bullish trend will be resumed.
If the daily price breaks 99.56 support level to below on close bar so the bearish reversal will be started.
If not so the price will be on ranging within the levels waiting for direction.
GBP/USD Intra-Day Fundamentals: U.K. Factory production and 30 pips range price movement
2017-02-10 09:30 GMT | [GBP - Manufacturing Production]
if actual > forecast (or previous one) = good for currency (for GBP in our case)
[GBP - Manufacturing Production] = Change in the total inflation-adjusted value of output produced by manufacturers.
==========
From official report:
==========
GBP/USD M5: 30 pips range price movement by U.K. Factory production news event
USD/CAD Intra-Day Fundamentals: Canada's Employment Change and 64 pips range price movement
2017-02-10 13:30 GMT | [CAD - Employment Change]
if actual > forecast (or previous one) = good for currency (for CAD in our case)
[CAD - Employment Change] = Change in the number of employed people during the previous month.
==========
From official report:
==========
USD/CAD M5: 64 pips range price movement by Canada's Employment Change news event