Join our fan page
- Views:
- 33156
- Rating:
- Published:
- Updated:
-
 You are missing trading opportunities:
- Free trading apps
- Over 8,000 signals for copying
- Economic news for exploring financial markets
Registration Log inYou agree to website policy and terms of use
If you do not have an account, please register -
 Need a robot or indicator based on this code? Order it on Freelance
Go to Freelance
Need a robot or indicator based on this code? Order it on Freelance
Go to Freelance
Author:
HajarWae
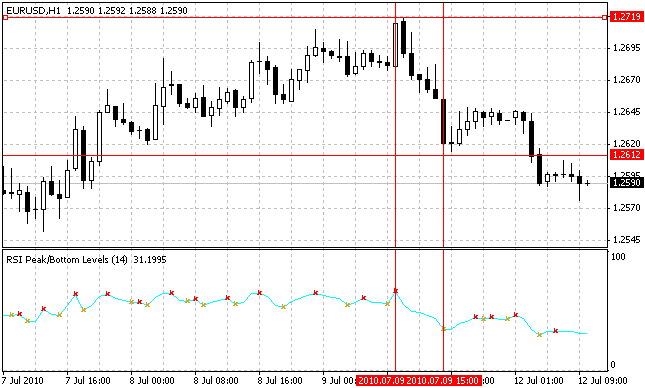
The peak/bottom could show the top level of RSI. When rsi passed the top/bottom value it indicated a buy/sel signal.
It can show the signal earlier but still need some filter, so this methode could be combined with others indicator as a filters.
Red arrow is peak and Yellow arrow is bottom.
I want to plot/draw rsi level based on peak/bottom possition. but i have a problem about the code to modify this indicator. need help to make it perfect.
I want to plot all of the peak/bottom towards then we will get any level at the peak/bottom. and when rsi cross the peak/bottom line, the level will be terminated 1 candle after crossing.
the calculating & plotting of others level will be continued until rsi cossing the level again.
can any body help???
please share....
Recommendations:
- Use This RSI levels as a Signal
- Combine with others indicators as a filter
 Daily Opening EA (needs improvement ideas!)
A slightly different EA based off daily opening breaks.
 USD Strength Effect Indicator
This indicator uses the position and direction of 7 pairs to gauge the overall effect that (by default) the USD currency may have on the pair that you are trading. Base currency can be changed.
Indicator Pivot Multi Time
Indicator that shows two resistance levels, 2 levels of support and pivot, they calculated the traditional way.
Average Change V 0
This is the basic version of the Average Change indicator