 MetaTrader 5
 Experts
 Indicators
 Scripts
 Libraries
 Storage
Watch how to download trading robots for free
Find us on Telegram!
Join our fan page
Join our fan page
You liked the script? Try it in the MetaTrader 5 terminal

PRO DAY TRADING SIGNALS - indicator for MetaTrader 5
Marian Beceanu

Atlas Enterprise Matrix:
https://www.mql5.com/en/market/product/183575
ZigZag Maturity — Multi-Timeframe Swing Maturity & Reversal Probability Dashboard
https://www.mql5.com/en/market/product/183575
ZigZag Maturity — Multi-Timeframe Swing Maturity & Reversal Probability Dashboard
- Views:
- 12
- Published:
-
 You are missing trading opportunities:
- Free trading apps
- Over 8,000 signals for copying
- Economic news for exploring financial markets
Registration Log inYou agree to website policy and terms of use
If you do not have an account, please register -
 Need a robot or indicator based on this code? Order it on Freelance
Go to Freelance

PRO Day Trading Signals (PRO DTS): how it works
What it is
A non-repainting M15 signal indicator for MT5. It combines three ideas:
Trade only in the direction of the higher-timeframe trend (H4 and H1).
Enter after a liquidity sweep (a stop-hunt) at the M15 EMA20/50 zone.
Confirm with momentum (RSI plus a strong candle body).
It draws BUY/SELL arrows on closed bars only. For every signal it gives a ready entry, stop loss, two take-profits and a lot size. It works on M15 only; on any other timeframe it shows "WRONG TIMEFRAME".
Signal logic
Everything is evaluated on the last closed M15 candle. All conditions must be true at once.
1. Trend filter (H4 + H1, using the last closed higher-TF bar)
BUY needs all three: H4 close above EMA200, H1 EMA20 above EMA50, and H1 close above EMA200.
SELL is the exact mirror: H4 close below EMA200, H1 EMA20 below EMA50, H1 close below EMA200.
If neither set holds, the bias is NEUTRAL and no signal is possible.
2. EMA zone (M15)
The candle must touch the area between EMA20 and EMA50. This means price is pulling back into the "value zone" of the trend rather than chasing an extended move.
3. Liquidity sweep
The indicator takes the lowest low and highest high of the previous 10 bars (Sweep_Lookback).
Bullish sweep: the candle's low breaks below that previous low, but the candle closes back above it. Sellers' stops were taken, then price rejected.
Bearish sweep: the high breaks above the previous high, but the candle closes back below it.
4. Candle body size
The body (open to close) must be at least 0.30 × ATR. This filters out weak, indecisive candles.
5. Momentum
BUY: bullish candle (close above open), close above EMA20, and RSI ≥ 52.
SELL: bearish candle, close below EMA20, and RSI ≤ 48.
In short: a BUY is a pullback into the EMA zone, inside an uptrend, where price swept the lows and closed back up with a strong, momentum-backed candle. A SELL is the mirror image.
Trade plan generated for each signal
Item Calculation
Entry Close of the signal candle
Stop loss Beyond the sweep wick, plus a 0.20 × ATR buffer (below the low for BUY, above the high for SELL)
TP1 Entry ± 2R (risk-to-reward 1:2)
TP2 Entry ± 3R (risk-to-reward 1:3)
Arrow Placed 0.15 × ATR away from the candle so it never overlaps it
Because the stop sits just beyond the sweep wick, risk is usually tight and defined by market structure rather than a fixed number of pips.
Real-trading features
Position sizing.
Lot size is calculated from Risk_Percent (default 1% of balance) and the SL distance.
It uses the symbol's tick value and respects min/max lot and step.
If the broker's minimum lot would exceed your risk by more than 5%, it flags "MIN LOT".
It also shows the required margin versus free margin.
Entry quality check. The dashboard rates the latest signal live:
VALID ENTRY: the signal is fresh and price has not run away.
LATE ENTRY: more than 2 bars have passed (Max_Entry_Age_Bars).
CHASING: price is already more than 0.5R in profit (Max_Chase_R), so the risk/reward is no longer what was planned.
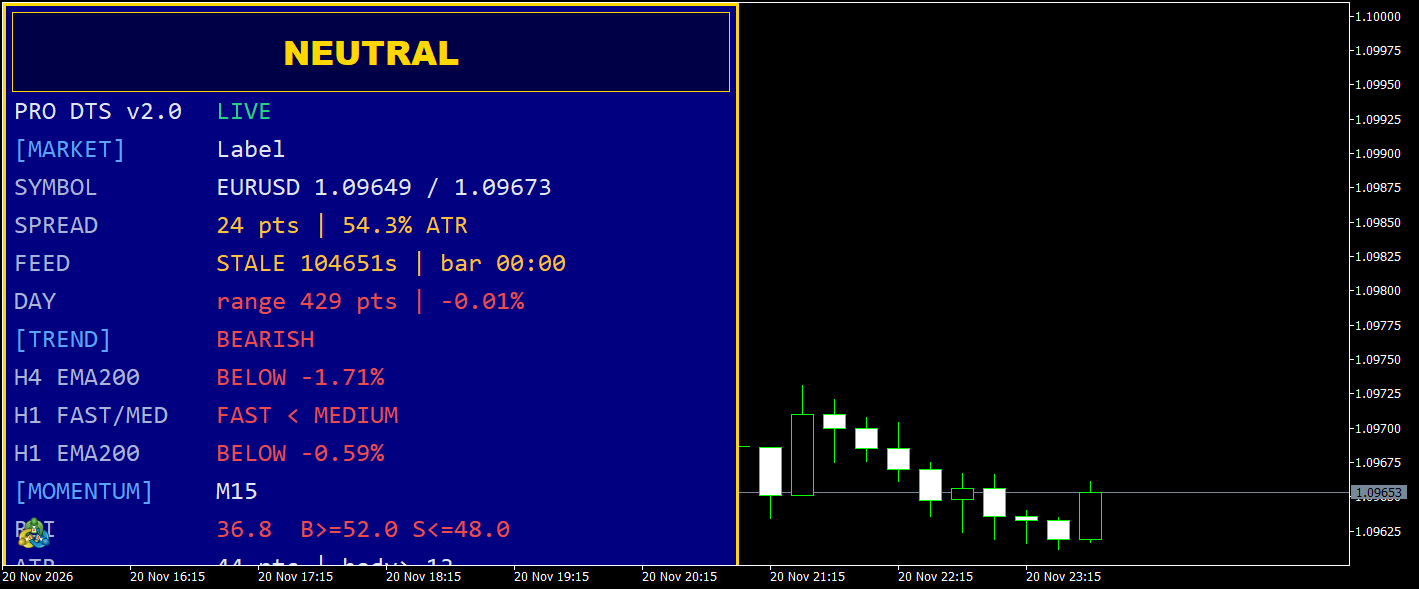
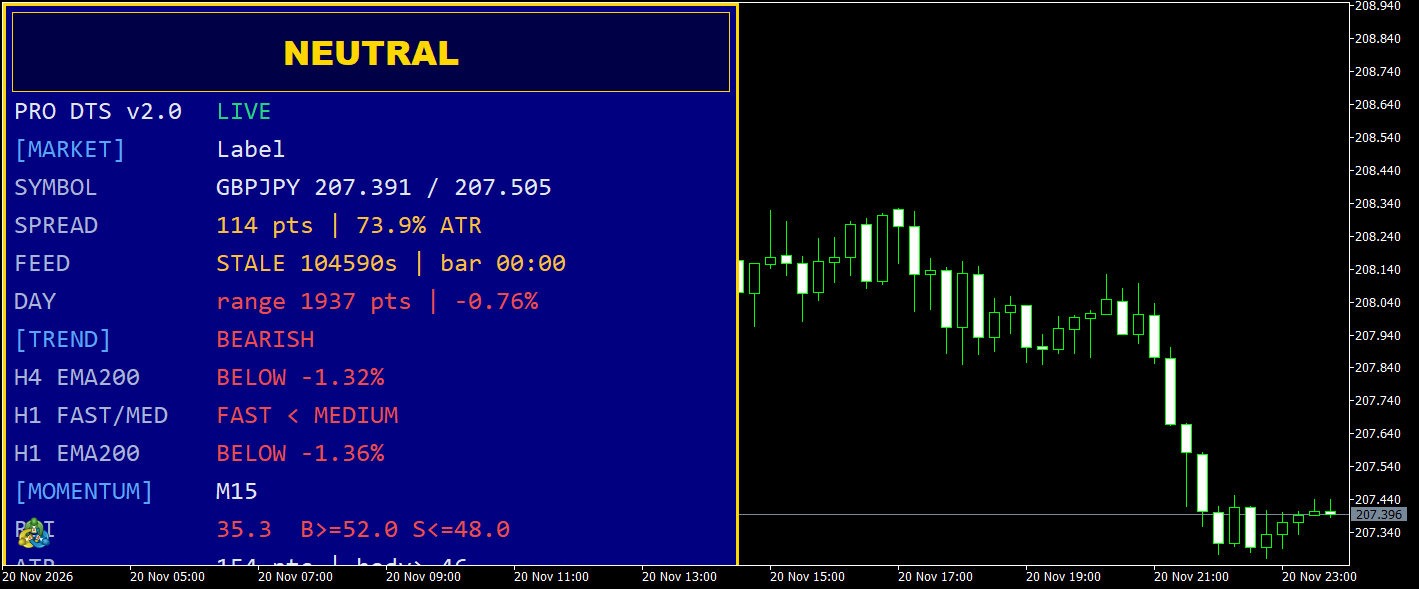
The big banner shows BUY SIGNAL or SELL SIGNAL only while the entry is still valid. Otherwise it shows NEUTRAL.
Trade tracking. The latest signal is monitored live, with floating profit shown in R:
TP1 REACHED: a prompt to manage the trade.
TP2 REACHED: the trade is closed at 3R.
SL HIT: shown as -1R.
STOPPED AFTER TP1: the trade hit TP1 first, then stopped out.
If SL and TP are touched in the same bar, it conservatively assumes the SL came first.
Statistics. The indicator back-tests its own signals on the loaded history (default 3000 bars). It counts total signals, wins, losses, open trades and TP2 hits.
Spread filter. If you set Max_Spread_Points, the dashboard and the alert warn when spread is too high. It is a warning only, and it does not block signals.
Alerts. Alerts fire once, on the first closed bar of a signal, never on history or when you attach the indicator. They can be a popup, a sound, a mobile push or an email. The message contains symbol, entry, SL, TP1, TP2 and lot size.
Chart lines. Entry, SL, TP1 and TP2 lines are drawn for the active setup and extend 20 bars to the right.
Dashboard. It shows:
Market: price, spread, feed status, bar countdown and daily range.
Trend: H4 and H1 status.
Momentum: RSI and ATR.
Setup checklist: BUY and SELL, each as T/Z/S/B/M ticks (Trend, Zone, Sweep, Body, Momentum).
Last signal.
Risk and account details.
Open positions on the symbol.
The checklist lets you see how close the market is to a signal, for example "4 of 5 conditions met".
No repainting, no look-ahead
Signals come only from closed bars, so an arrow never disappears or moves.
The H4/H1 values use the last closed higher-timeframe bar relative to each M15 candle, so there is no hidden future information in the back-tests.
Practical notes
It is a selective, conservative system: five conditions must align, so it will give few signals, mostly in trending sessions.
A fixed 1:2 or 1:3 reward is only as good as the win rate. Check the built-in stats on your symbols and run it on a demo account first.
It does not place trades itself. It is a signal and risk-planning tool, and you execute manually using the lot size and levels it provides.
The stats are a simplified simulation (they ignore spread and slippage), so live results will differ somewhat.
Closed-bar alert example
An MQL5 indicator example that checks the latest closed candle and suppresses duplicate alerts.
Gold Weekend Gap Map (XAUUSD): gap size in ADR and fill time
Marks every weekend gap on the chart, measures it in price and in ADR, shows whether and how fast it was filled, and keeps fill statistics for recent weeks. Display only, it does not trade.
Accelerator Oscillator (AC)
The Acceleration/Deceleration Indicator (AC) measures acceleration and deceleration of the current driving force.
MACD Signals
Indicator edition for new platform.